New BigQuery ML Preprocessing Functions

Subscribe to our monthly newsletter to get the latest updates in your inbox

BigQuery preprocessing features (announced in Beta on November 21, 2019) allow its users to transform the input data using a set of data processing functions used in data science such as standard scaler, min-max scaler, bucketize, etc. The added functionality speeds up the data preparation process for not only Machine Learning (ML) related problems, but also for many reporting and other analytical use cases. Doing some of these transformations has already been possible using SQL or UDFs, however, as you will see below, this addition vastly decreases the implementation time.

Preprocessing Functions

  • Bucketize
    • Will assign a bucket value (string) to a numerical input (column), based on the array boundaries provided.
    • Example: A continuous parameter value such as temperature can be bucketed into cold, cool, neutral, warm and hot.
    • Great for histogram analysis, preparation for visualizations and building categories as a part of feature engineering for ML.
  • Polynomial Expand
    • Will combine a multiplication of all the input parameters up to a selected degree.
    • Example: An input of a=2, b=3, c=4 and degree 2 would return: a,b,c, a*a, a*b, a*c, b*b, b*c and c*c
    • Accelerated feature engineering.
  • Feature Cross
    • Will concatenate all combinations of input values to a selected degree.
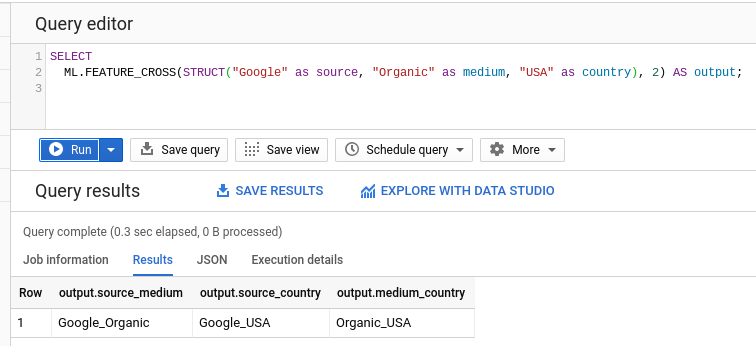
    • Example: An input of 3 columns (source, medium, country) "Google", "Organic", "USA" limited to 2nd degree would product "Google_Organic", "Google_USA" and "Organic_USA"
    • Allows for accelerated feature engineering, a quick way to help find synergy between categorical features.
  • NGrams
    • Concatenates neighboring elements into a range of n  (2-grams, 3-grams etc.). Unlike with feature cross where the separator is preset to an underscore, you can manually specify one.
    • Example: same input as in the previous example, with n-gram size 2 and 3 and separator "$" would return: "Google$Organic", "Organic$USA" and "Google$Organic$USA".
    • Another quick way to engineer features from within BigQuery.
  • Quantile Bucketize
    • Groups a numerical feature into buckets of equal frequencies. Even though this function uses OVER windowing a non-empty OVER() clause is disallowed. (This function is closely related to existing APPROX_QUANTILES and PERCENTILE_CONT available in standard SQL).
    • Example: An expected output for an input of [1,2,3,4] and quartile (4-buckets) would be [bin_1, bin_2, bin_3, bin_4]
    • This is another quick way to feature engineer and group numerical values.
  • Min Max Scaler
    • Translates all the values of a numerical column to a 0 to 1 scale. Even though this function uses OVER windowing a non-empty OVER() clause is disallowed.
    • Example: An input of [1,2,3,4,5] would go through a function f(x) = (x -1)/4 and turn the input into [0, 0.25, 0.5, 0.75, 1] output.
    • This is a standard procedure before using features for ML processes such as k-means clustering.
  • Standard Scaler
    • Translates all the values of a numerical column to a new scale via Z-score Normalization. Even though this function uses OVER windowing a non-empty OVER() clause is disallowed.
    • Example: An input of [1,2,3,4,5] would go through a function f(x) = (x -avg(x))/(std dev(x) and turn the input into outputs between -1.2649110640673518 and 1.2649110640673518 with 3 being the mean and therefore transformed into 0.
    • This is a standard procedure before using features for ML processes such as k-means clustering. BQML k-means automatically preprocesses the data with metric standardization.

Use Case

Bucketize

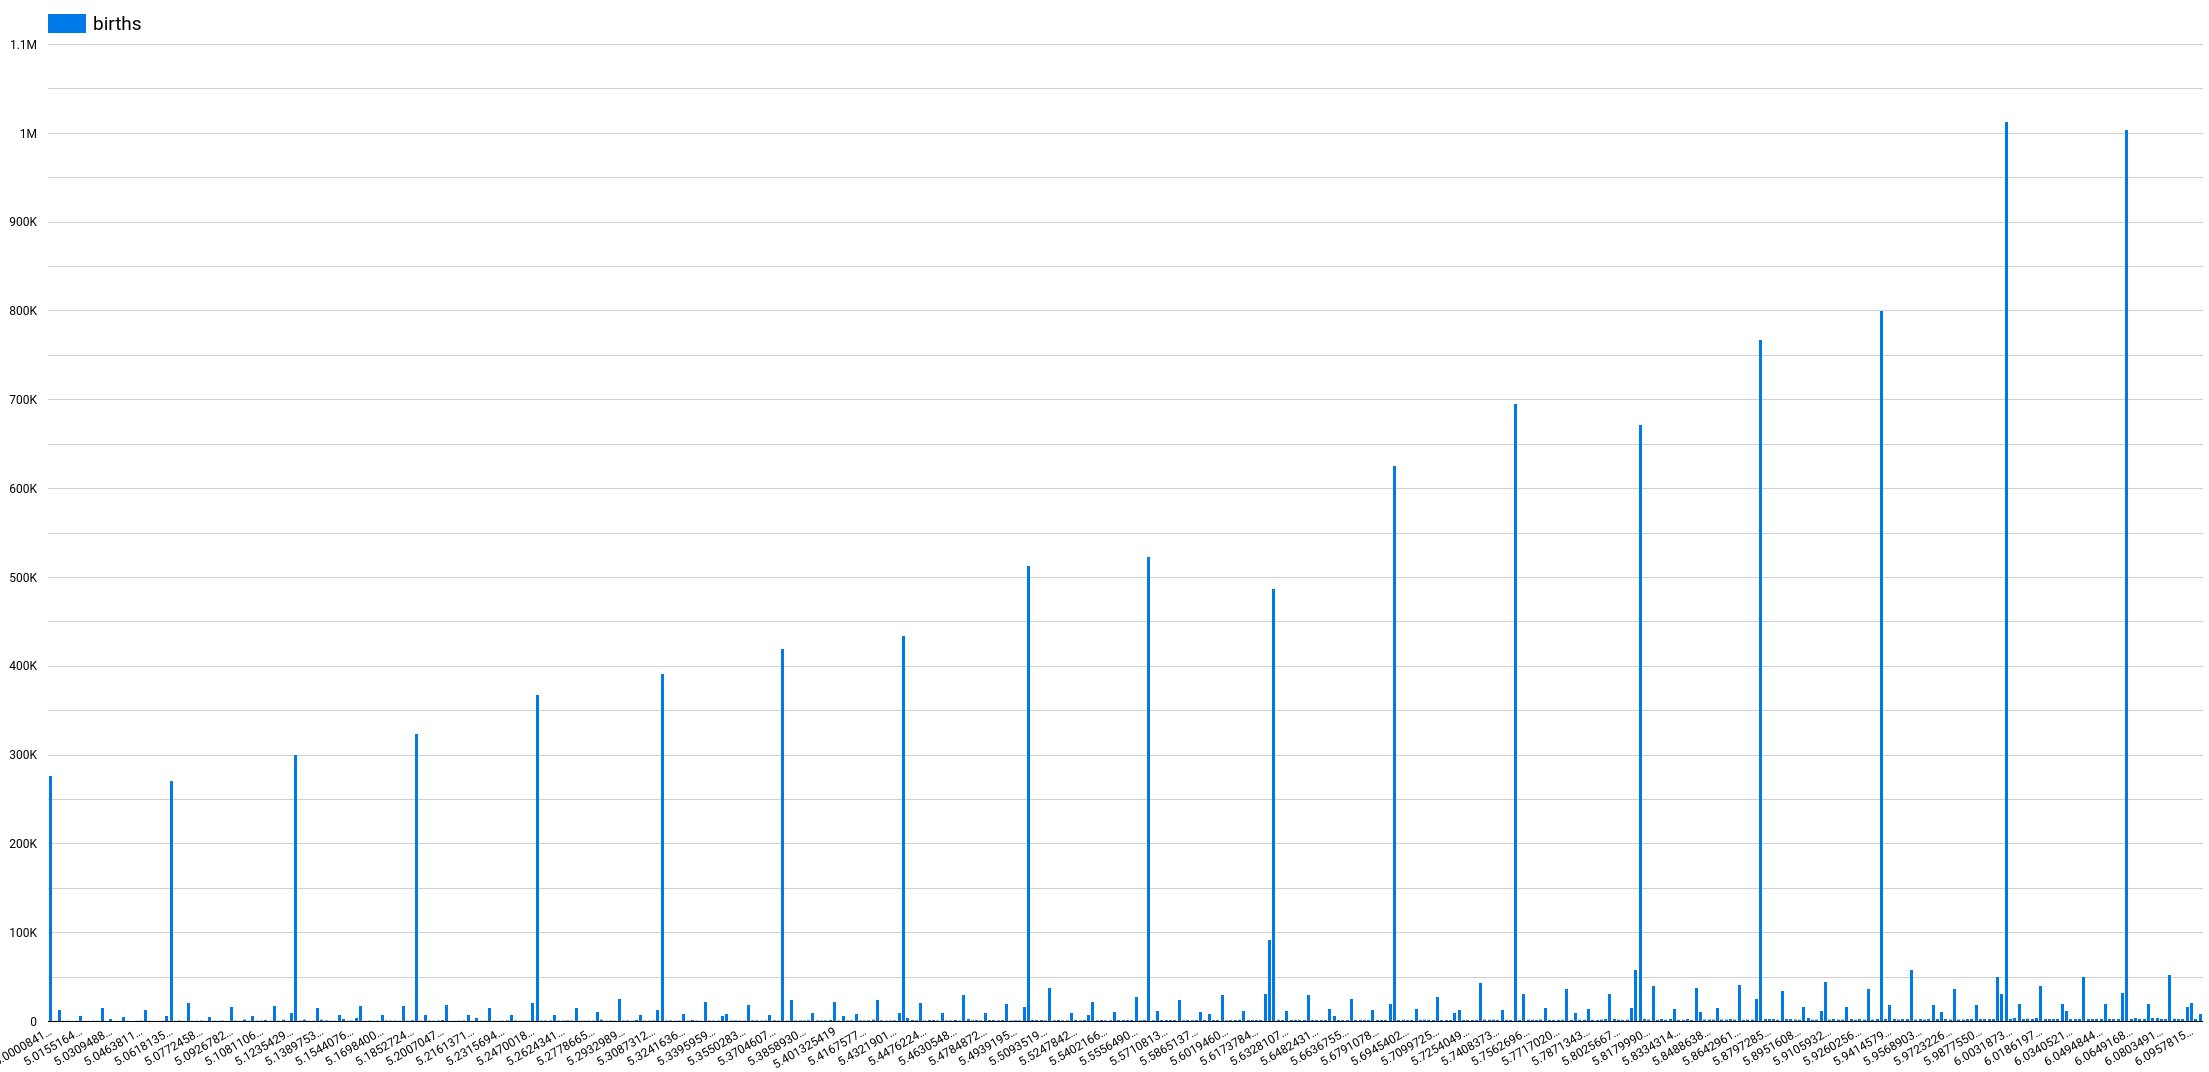
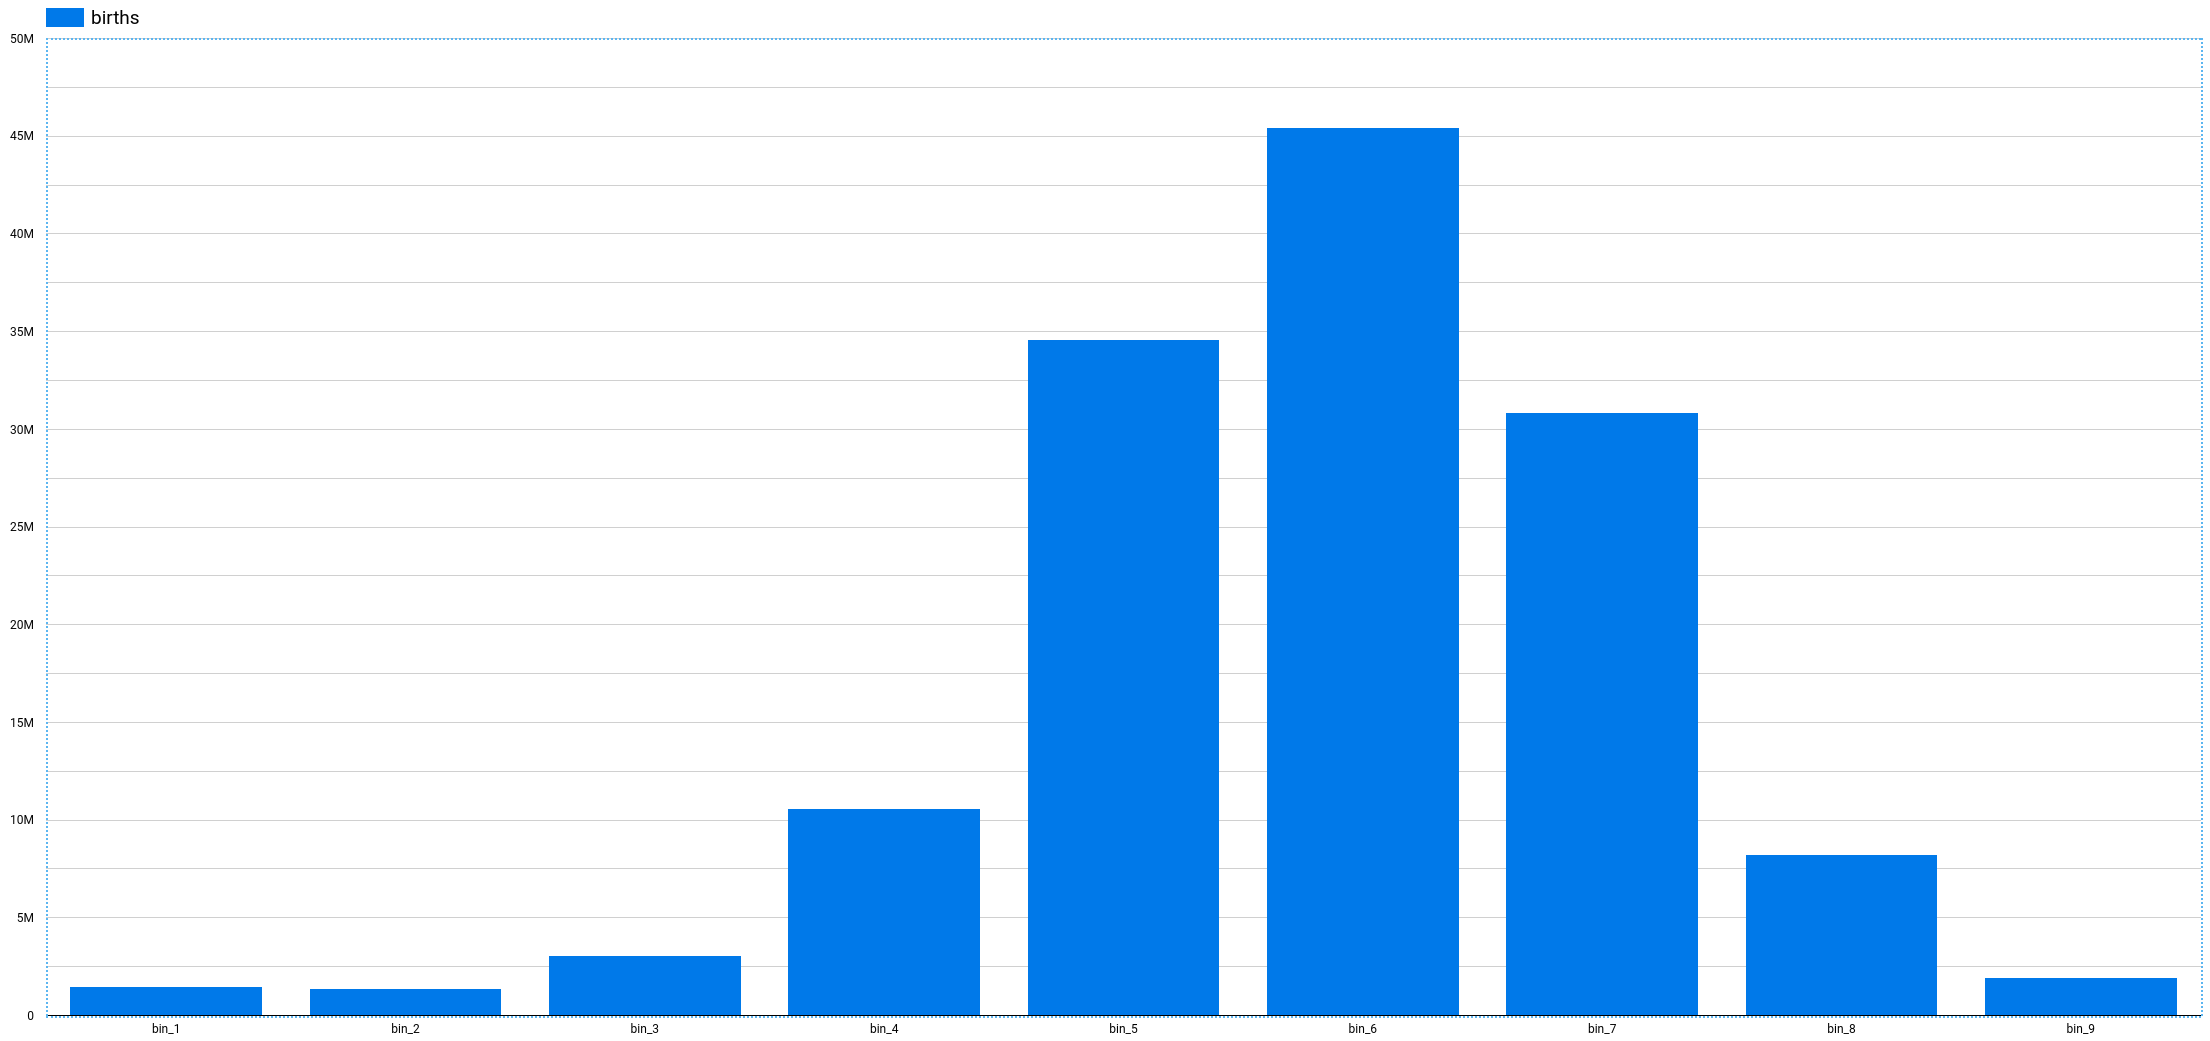
This is a very common transformation used to turn continuous numerical values into categories. In reporting, we often use it to build histograms. In the following example, I'm "bucketizing" the birth weight of babies in pounds from a publicly available BigQuery dataset Natality. As a father to a 2-year old boy and a new father to a baby girl, I've spent quite a bit of my time in the past couple of years exploring this dataset, trying to predict the size of my children at birth and then seeing how their measurements compare to others. As you can see from the first visualization below, because of the way the birth weight data is provided to us, it is very hard to create a decent visualization without first transforming the weight_pounds column into groups. In this case, we created 9 groups (or bins) using the ML.BUCKETIZE(weight_pounds, [3,4,5,6,7,8,9,10]). Bin 1 with weights under 3 pounds, bin 2 from including 3 to 4 pounds, bin 3 from including 4 to 5 pounds, ..., bin 9 with weights above and including 10 pounds. The bins calculation includes floor and excludes ceiling: 2 pounds --> bin 1 3 pounds --> bin 2 3.999999 pounds --> bin 2 4 pounds --> bin 3 Visualization before Bucketizing [sourcecode language="sql"] SELECT weight_pounds, COUNT(*) AS births FROM `bigquery-public-data.samples.natality` WHERE weight_pounds IS NOT NULL GROUP BY 1 ORDER BY 1 ASC [/sourcecode] Visualization after using ML.BUCKETIZE [sourcecode language="sql" highlight="2"] SELECT ML.BUCKETIZE(weight_pounds, [3,4,5,6,7,8,9,10]) weight_pounds_group, COUNT(*) AS births FROM `bigquery-public-data.samples.natality` WHERE weight_pounds IS NOT NULL GROUP BY 1 ORDER BY 1 ASC [/sourcecode] The ML.BUCKETIZE saves us from a  tedious CASE WHEN statement, or a more mathematical transformation and elegantly solves the problem. We could also take our ML.BUCKETIZE a step further by replacing the input array with GENERATE_ARRAY(3, 10, 1). *The bucket naming is currently preset to bin_<bucket number>.
Quantile Bucketize (Percentile)

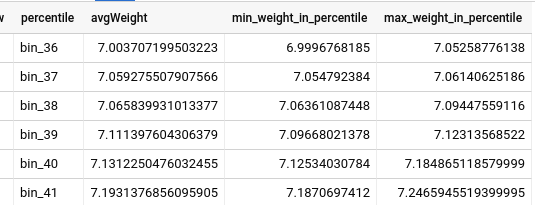
To continue the previous example, if we wanted to create a percentile table for newborn girls, that would allow us to quickly place them into a weight percentile. We could now achieve this quickly with the following query: [sourcecode language="sql" highlight="9,10"] SELECT percentile, AVG(weight_pounds) avgWeight, MIN(weight_pounds) AS min_weight_in_percentile, MAX(weight_pounds) AS max_weight_in_percentile FROM ( SELECT weight_pounds, ML.QUANTILE_BUCKETIZE(weight_pounds, 100) OVER() AS percentile FROM `bigquery-public-data.samples.natality` WHERE weight_pounds IS NOT NULL AND NOT is_male ) GROUP BY percentile ORDER BY 2 ASC [/sourcecode] For example, a weight of 7.12 pounds would place a newborn girl into 39th percentile.

Overview

The addition of preprocessing functions to BigQuery provides Data Scientists a great way to execute data transformations in a distributed environment without worrying about any of the infrastructure behind it. On the other hand, it also brings some of more complex data transformations closer to everyday data explorers to provide them with tools needed to speed up analysis and reporting.

Resources

Official Documentation
Please reach out with any questions or feedback to @lukaslo and @adswerve on Twitter.