Looking to export your GA4 data? Be sure to check out our latest blog: GA4 BigQuery Guide: Users and Sessions (Part One)
+In part two of the Google Analytics + Bigquery Tips series, we covered nesting in the Google Analytics (GA) BigQuery (BQ) export. Up now: Calculating page-specific metrics.
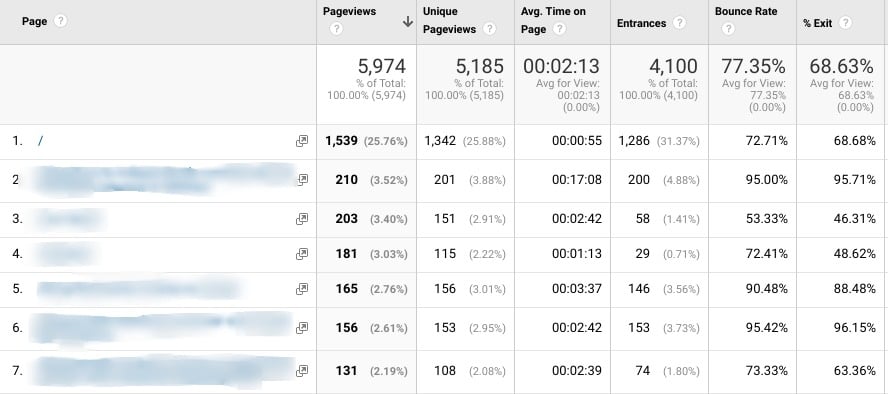
Page reports are some of the more popular within Google Analytics. Providing metrics such as pageviews, unique pageviews, average time on page, entrances, exits, etc. Even though most of these metrics seem pretty straightforward, there may be some hidden definitions (traps) that we need to consider when calculating those values within BQ.
Pageviews, Entrances and Exits
To calculate page metrics, we need to work on a hit-scope by unnesting hits. Because we are only dealing with pageviews and pageview-related metrics we can filter to hit type page only, which will exclude events and any other less common hit types. Once the filter is set up, we can start calculating the actual metrics:
- Pageviews - count the number of rows
- Entrances - count the number of rows where isEntrance flag is true (isEntrance flag will be true on the first page hit type of the session)
- Exits - count the number of rows where isExit flag is true (isExit flag will be true on the last page hit type of the session)
- Exit Rate - share of exits per pageview
[sourcecode language="sql" title="Pageviews, Entrances, Exits, etc." highlight="8"]SELECT
hits.page.pagePath,
count(*) as pageviews,
countif(hits.isEntrance) as entrances,
countif(hits.isExit) as exits,
round(100*(countif(hits.isExit)/count(*)), 2) as exitRate
FROM `projectId.datasetId.tableId`, unnest(hits) as hits
WHERE hits.type = "PAGE"
GROUP BY 1
ORDER BY 2 DESC[/sourcecode]
What Is Happening with Unique Pageviews Calculations?
Even though Unique Pageviews (upv) may look like a very straightforward metric (number of sessions with a pageview on a specific page path), there are a few additional rules to consider. If you look closely at the definition of a unique pageview in Google Analytics, you will notice that page path's title also contributes to the unique count. Therefore, any pages with a dynamic page title will have to include the title in their upv calculation. Finally, because of a possibility that a page title is not set, we have to handle "null" cases.

[sourcecode language="sql" title="Pageviews, Unique Pageviews etc." highlight="6"]SELECT
pagePath,
count(*) as pageviews,
count(distinct sessionId) as upv1,
count(distinct CONCAT(sessionId, pageTitle)) as upv2,
count(distinct CONCAT(sessionId, IFNULL(pageTitle, ""))) as upv3
FROM
     (SELECT hits.page.pagePath,
     hits.page.pageTitle,
     CONCAT(clientId, visitStartTime) as sessionId
     FROM `projectId.datasetId.tableId`, unnest(hits) as hits
     WHERE hits.type = "PAGE")
GROUP BY 1 ORDER BY 2 DESC [/sourcecode]
In the query above, the upv3 in line six should match your Google Analytics UI. However, upv1 and upv2 will, in most cases, produce the same number and provide you with a metric that may not exactly match the UI, but may in some cases be more useful.
Total Time on Page Metric
Time on page is calculated as the delta between the time of the current pageview and the time of the following pageview. In case no pageviews follow the current one, the time of the last interactive event is used to calculate the delta. As you will see, any pageviews that are not followed by an interactive event or another pageview, do not contribute to the average time on page.
The query below provides us with a total time on page in milliseconds for each page path, using the algorithm described above.
[sourcecode language="sql" title="Total Time on Page" highlight="4,11"]totalTimeOnPageQuery AS (
  SELECT
    pagePath,
    SUM(nextTime-time) AS totalTimeOnPage,
    COUNTIF(type = "PAGE") AS pageviews,
    COUNTIF(type= "PAGE"
      AND isExit IS NULL) nonExitPageviews
  FROM (
    SELECT
      *,
      LAG(time, 1) OVER (PARTITION BY clientId, visitStartTime ORDER BY time DESC) AS nextTime
    FROM (
      SELECT
        clientId,
        visitStartTime,
        hits.hitNumber,
        hits.page.pagePath,
        hits.type,
        hits.isExit,
        hits.time,
        FIRST_VALUE(hits.time) OVER (PARTITION BY clientId, visitStartTime ORDER BY hits.time DESC) AS lastEventTime
      FROM
        `projectId.datasetId.ga_sessions_20200309`,
        UNNEST(hits) AS hits
      WHERE
        type="PAGE"
        OR hits.isInteraction )
    WHERE
      type = "PAGE"
      OR time=lastEventTime )
  GROUP BY
    1
  ORDER BY
    3 DESC[/sourcecode]
You may notice that we used (analytic) window functions in lines 11 and 21. These allow us to define a window of hits for each session using partition by clientId and visitStartTime. Once the window is defined, we can find the last hit or next hit of a session relative to the current hit (row).
Average Time on Page Metric
To get the average time on page we need to divide the total time on page with the number of pageviews. Here is where things get very interesting. Google Analytics does not divide the total time on page with the number of pageviews, but rather with the number of non-exit pageviews. This means that a bounce followed by an interactive event will contribute to the total time on page, but will not be used to increase the divider when calculating the average. This is likely a consequence of a decision made to handle bounces and exit pages within GA. Unfortunately, this also means that pages with a decent amount of interactive events and a high bounce rate will have inflated average time on page (time between a page load and interactive event will be contributed to the numerator, however the denominator will not increase). BigQuery offers you a great way to define your own average time on page, and the query below shows you how this is done in the UI.
[sourcecode language="sql" title="Average Time on Page" highlight="48"]CREATE TEMP FUNCTION
timeHM(x FLOAT64)
RETURNS STRING
LANGUAGE js AS """
x = x/1000;
var hour = parseInt(x/60);
var minute = parseInt((x + 0.5)%60);
return hour + ":" + minute; """
WITH
totalTimeOnPageQuery AS (
SELECT
pagePath,
SUM(nextTime-time) AS totalTimeOnPage,
COUNTIF(type = "PAGE") AS pageviews,
COUNTIF(type= "PAGE"
AND isExit IS NULL) nonExitPageviews
FROM (
SELECT
*,
LAG(time, 1) OVER (PARTITION BY clientId, visitStartTime ORDER BY time DESC) AS nextTime
FROM (
SELECT
clientId,
visitStartTime,
hits.hitNumber,
hits.page.pagePath,
hits.type,
hits.isExit,
hits.time,
FIRST_VALUE(hits.time) OVER (PARTITION BY clientId, visitStartTime ORDER BY hits.time DESC) AS lastEventTime
FROM
`projectId.datasetId.ga_sessions_20200309`,
UNNEST(hits) AS hits
WHERE
type="PAGE"
OR hits.isInteraction )
WHERE
type = "PAGE"
OR time=lastEventTime )
GROUP BY
1
ORDER BY
3 DESC)
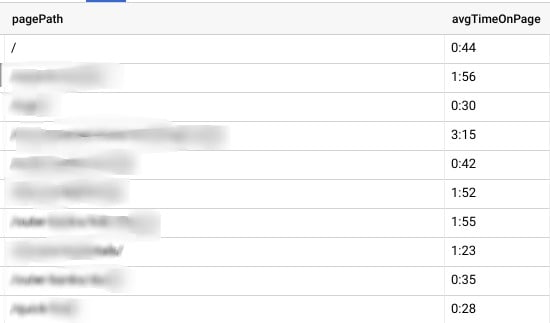
SELECT
pagePath,
timeHM(SAFE_DIVIDE(totalTimeOnPage, nonExitPageviews)) as avgTimeOnPage
FROM
totalTimeOnPageQuery
[/sourcecode]
Because it is possible that a page path only has exit pageviews, we need to use a safe divide function to avoid dividing the total time on page with zero pageviews. I have also created a simple temporary UDF function to transform time in milliseconds to minutes and seconds.
Up Next: Part Four
In part four, I will explain how to write queries to build user segments and create your own attribution reports.
Please reach out with any questions or feedback to @lukaslo and @adswerveinc on Twitter.