- Data, Media & AI
- Who We Serve
- Tech Partners
- Insights
- About Us
- Client portal
Adswerve Connect client technology platform sign-in
SIGN IN WITH
Sign in with Google
Sign in with Microsoft
Not a client yet?
When you partner with Adswerve, you get exclusive access to Adswerve Connect, your central hub for everything you need to succeed. As an Adswerve client, you will have immediate access to hundreds of training videos to deepen your expertise, the latest industry news and insights, all of your account and billing information and proprietary tools and applications designed to help you get more done.


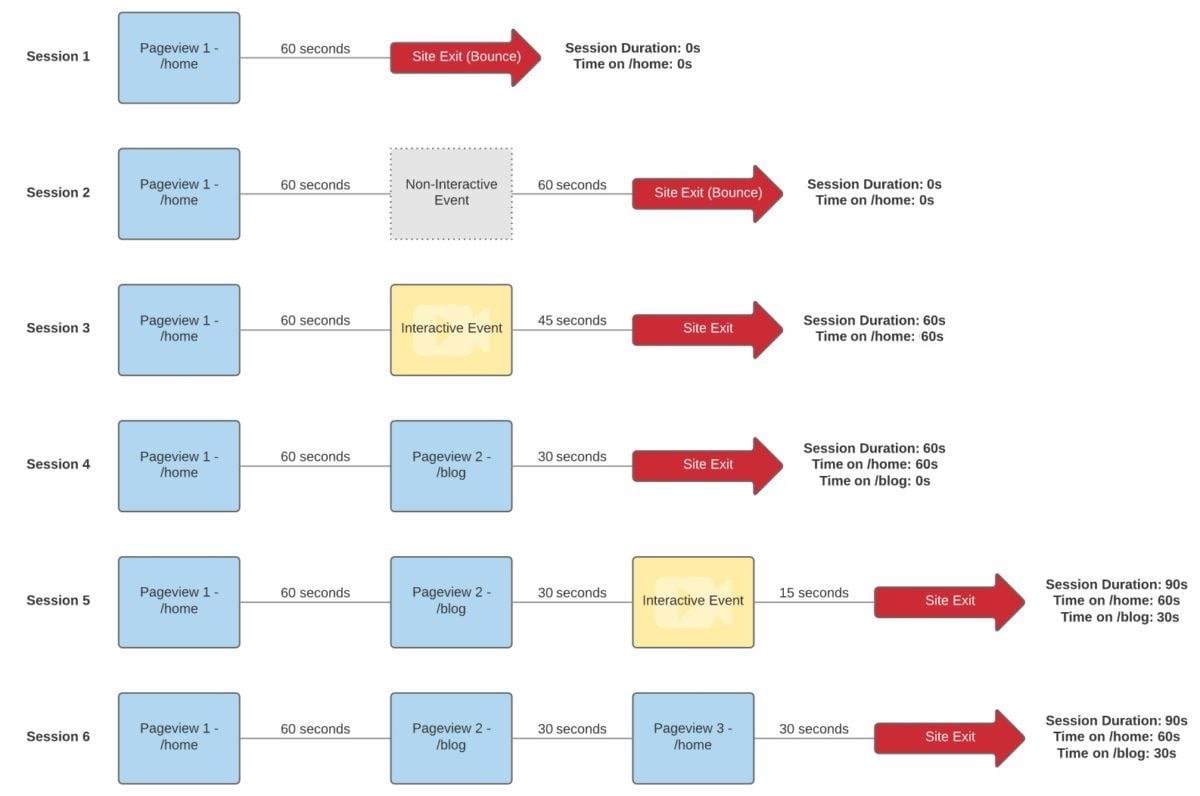
 In our first example, we see our typical "bounce" session where a user visits a single page without sending any other hits into Google Analytics (pageviews or events) despite staying on the website for 60 seconds total after /home pageload.
Session Duration: Since Google Analytics uses the time between the first interactive hit and the last interactive hit of a session to determine session duration, Google Analytics will calculate this session as 0 seconds.
Time on Page: For time on page, Google Analytics will only calculate the duration of time for a pageview upon pageload of the next pageview, therefore time on page for /home in this session would also be zero seconds since /home is also the exit page for the session.
 For our second session, we still have a bounced session, although the user had two hits sent to Google Analytics. They had their pageview and they had a non-interactive event (example: a scroll tracking event). This user stayed on the site for a total of 120 seconds (60 seconds between /home pageload and their scroll tracking event, and 60 seconds after their scroll tracking event before leaving the site).
Session Duration: Like our last session example, Google Analytics must have a first and last interactive hit to determine session duration. Because our only other hit was a non-interactive event, Google Analytics will still see this session as a single interactive hit session and the session duration will be calculated as 0 seconds.
Time on Page: Just like our last example session, since there is no other pageview, the calculation for time on page for /home will still be 0 seconds since /home is the exit page for the session.
 In our third example session, we now have two hits—both of which are interactive hits. This session would no longer be considered a bounce since we have a pageview and an interactive event (such as a video play). This user stayed on the site for a total of 105 seconds (60 seconds between /home pageload and their interactive video event, and 45 seconds after their video event before leaving the site).
Session Duration: Since this is no longer a bounced session, we now have the ability to calculate the duration between the first interactive hit of the session (pageload of /home) and the last interactive hit of the session (the video play event). This calculates our session duration in Google Analytics as 60 seconds.
Time on Page: Since there is an interactive event on /home, the time on /home will be the time between the initial pageload and the interactive event, therefore 60 seconds.
 In our fourth example session, we again have two hits—both of which are interactive hits and both are pageviews. Like our last example, this session is not a bounced session. The user stayed on the site for a total of 90 seconds (60 seconds between /home pageload and /blog pageload, and 30 seconds after visiting /blog before leaving the site).
Session Duration: Like our last session, this session duration is the calculation between our first interactive hit of the session (/home pageload) and the last interactive hit of the session (/blog pageload). This brings the session duration for this session to 60 seconds.
Time on Page: In this situation, we have two pageviews for which to calculate time on page. For /home, we have a second pageload to calculate the duration between pageviews since /home is not the exit page for the session. Therefore the time on page for /home is 60 seconds. However, /blog is the exit page for our session, so the user's time on page for /blog is 0 seconds.
 For our fifth example session, we have three hits sent to Google Analytics—all of which are interactive. The first two hits are pageviews and the third is an interactive event (such as a video play event). The user stayed on the site for a total of 105 seconds (60 seconds between /home pageload and /blog pageload, 30 seconds between /blog pageload and their video play event, and 15 seconds after their video play event before leaving the site).
Session Duration: Using the duration between our first interactive hit of the session (/home pageload) and our last interactive hit of the session (the video play event), we see what our session duration in Google Analytics would be 90 seconds (60 seconds + 30 seconds).
Time on Page: For /home, we have a second pageload to calculate the duration between pageviews since /home is not the exit page for the session. Therefore the time on page for /home is 60 seconds. We also have an interactive event that happens on /blog, so the time on page is 30 seconds as that is the time between the initial pageload of /blog and the interactive event.
 Finally, in our sixth session, we have three hits sent to Google Analytics—all of which are both interactive and pageviews. The user stayed on the site for a total of 120 seconds (60 seconds between /home pageload and /blog pageload, 30 seconds between /blog pageload and navigation back to /home, and finally 30 more seconds after /home pageload before leaving the site).
Session Duration: The session duration from the first interactive hit of the session (/home pageload) and the last interactive hit of the session (the second /home pageload) is 90 seconds (60 seconds +30 seconds).
Time on Page: This time we have three pageviews for our session. Our first time on page for /home is 60 seconds before the next pageload of /blog. Then, since /blog is not the exit page for the session, we have a time on page for /blog of 30 seconds before /home was loaded again. Finally, the second pageview to /home is our exit page, therefore the time on page for /home's second pageview is 0 seconds.
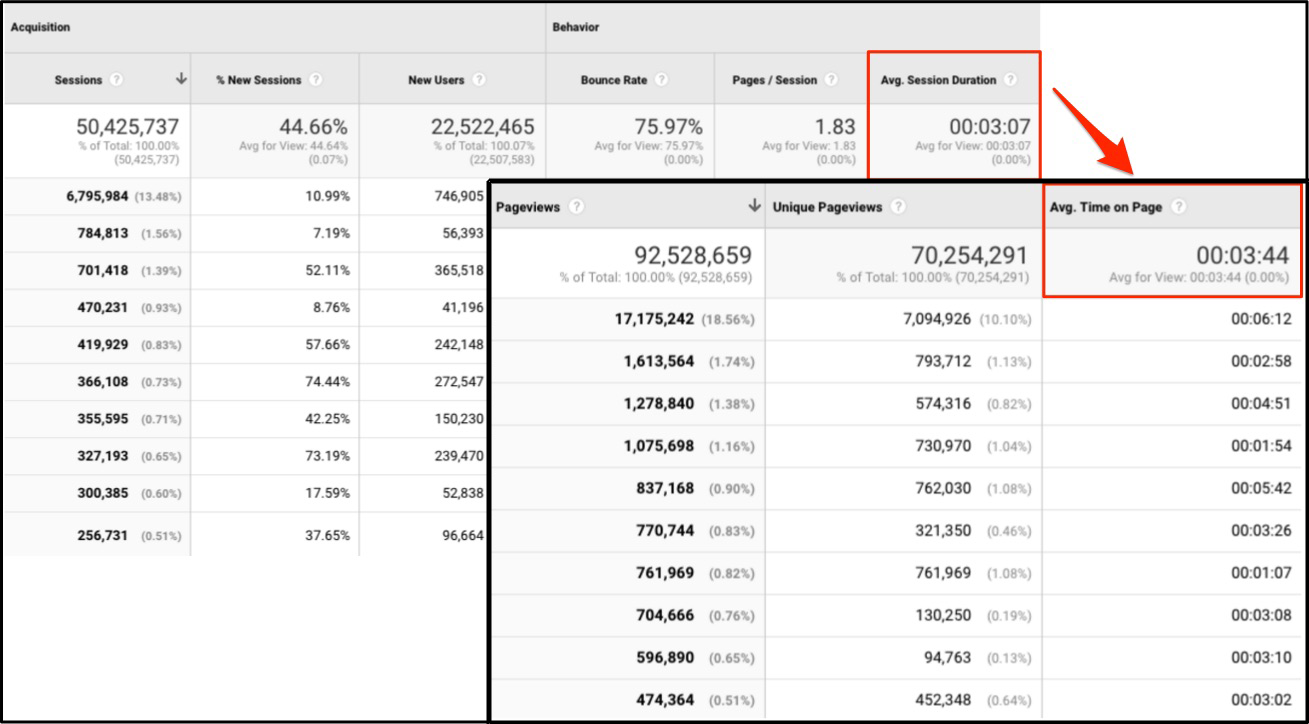
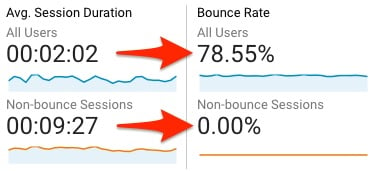
 This means that all of our 0-second sessions that were the result of bounced sessions will weigh down the average session duration across all of our sessions. As a result, the higher your bounce rate is, the lower your average session duration will be. The same is true not only for the site-wide average session duration but also when you look at session durations for specific dimensional values such as landing page, source/medium, and age/gender reports. We can see below when simply looking at a segment of non-bounce sessions compared to site average that the average session duration increases as we take away the bounces.
 To see how this gets calculated for our example sessions, we can see that our total session duration is 300 seconds and our total number of session is 6. Therefore our calculation is 300/6, or 50 seconds per session on average.


 Similarly, we can see that the average time on page for /home is 80 seconds (240 seconds/(6 total pageviews - 3 exits)), and our average time on page for /blog is 60 seconds (60 seconds/(4 total pageviews - 3 exits). In conclusion, we now see how we can use the metrics of Average Session Duration and Average Time on Page in Google Analytics as directional metrics to understand user engagement, but we must understand how other metrics like bounce rate, pages/session, and exit % will affect the average calculations that we see in our reports. For more information about our solution to the limitations of the Average Session Duration and Average Time on Page metrics, check out
