
When you compare Google Analytics 4 (GA4) reporting navigation to Universal Analytics (UA), you’ll notice a significant difference. The report menu and the look and feel of reports have been updated to work with the new event data model GA4 uses to collect data from your website or mobile app. Here I will provide tips for different components to help you customize your GA4 reporting.
GA4 Reporting and Menu Components
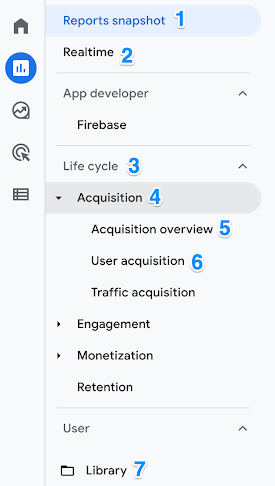
| # | Component | Allowance | Permissions |
| 1 | Reports Snapshot | 1 | edit |
| 2 | Realtime Report | 1 | - |
| 3 | Collection | 7 | edit, create, delete |
| 4 | Collection Topic | 5 per collection | edit, create, delete |
| 5 | Overview Report | 150 | edit, create, delete |
| 6 | Detail Report | 200 | edit, create, delete |
| 7 | Library | 1 | edit, create |
As a GA4 Property Editor and Administrator, you can fully customize the reporting menu to fit the needs of your organization.
1) The Snapshot Report:
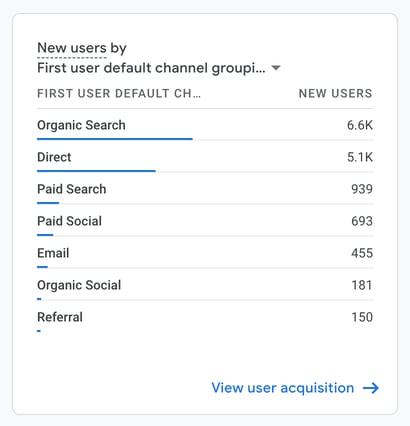
The snapshot report (or Reports snapshot) is an overview that users will see once they click Reports in the GA4 menu. By default, the snapshot report includes metrics outlined in what Google calls “cards”. Cards are created when you create custom detail reports. The real value of customizing the snapshot report is in the strategy behind creating and choosing which cards to include.
Snapshot Report Tips:
- Remove the clutter. If you don’t sell items or track revenue don’t include cards that have that empty data
- Learn what type of visualizations make the most impact. Cards can be a bar chart, pie chart, line chart, or a table
- When choosing multiple dimensions for your card, put the one that people will likely choose most often at the top so it becomes the default. For example, do you report more often by campaign, source, or medium?
- Narrow dimensions that are most relevant to your business. For example, if you operate solely or collect data from one country, show users by region or city rather than country to eliminate unnecessary clicking
- You only have 1 snapshot. My advice is to choose the most important dimension/metric combination from each overview report you have and display it here
Edits to the snapshot report and any custom report within the navigation will be reflected for everyone.
2) The Realtime Report:
As your GA4 property collects data through the Data Streams connected to your website(s) and/or mobile app(s) the Realtime report lets you monitor the activity as it happens. This report can’t be changed but you can add comparisons to it. Like the Snapshot report, this report also has cards providing data such as the count of users in the last 30 minutes and event counts by event name.
Realtime Report Tips:
- See how overall traffic is affected from a recent press release or social media update
- Monitor spikes from specific traffic sources, mediums, or campaigns.
- Verify that the tracking code is working on your site or app
- Watch for increases in views of specific content such as pages (web) or screens (app)
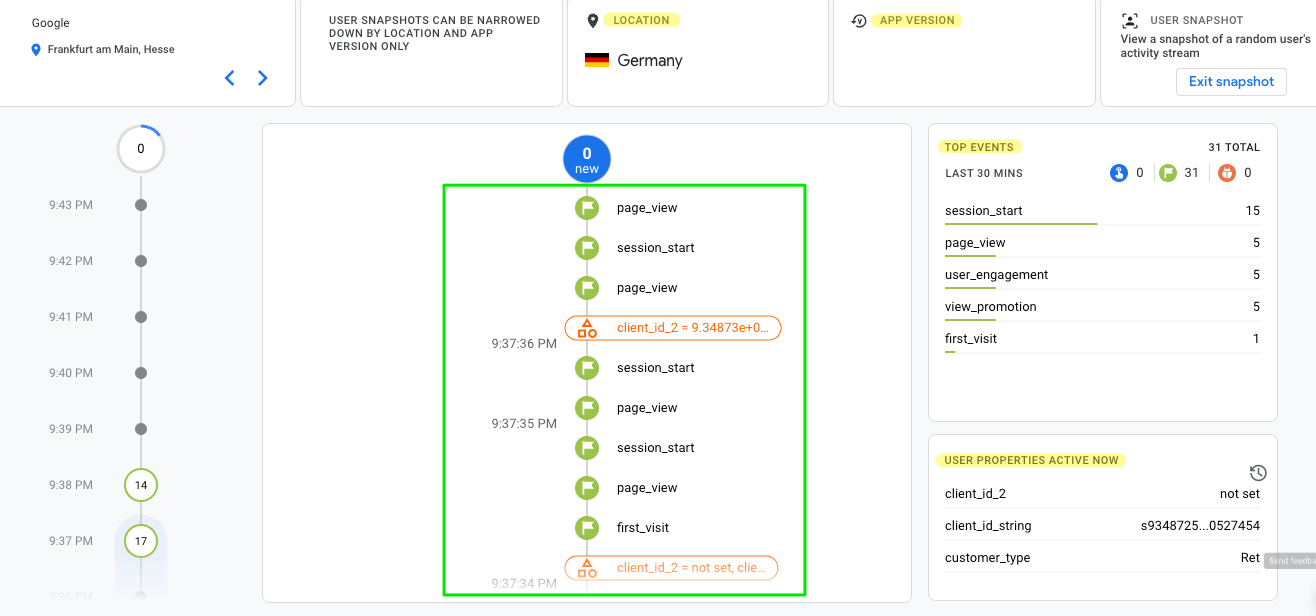
- Use the Realtime Snapshot feature to troubleshoot and/or confirm proper user flows are taken
The snapshot feature within the Realtime report can be useful to see a user’s device, app version, location, and top events triggered during their visit.
The GA4 Report Library
This is where the real magic happens and how you can begin making GA4 reporting work for you. Here you will find two types of assets called Reports and Collections. Reports will ultimately consist of “cards” that were mentioned earlier and once your reports are created, you will then choose the most appropriate way to categorize them into collections and eventually be displayed in the report menu.
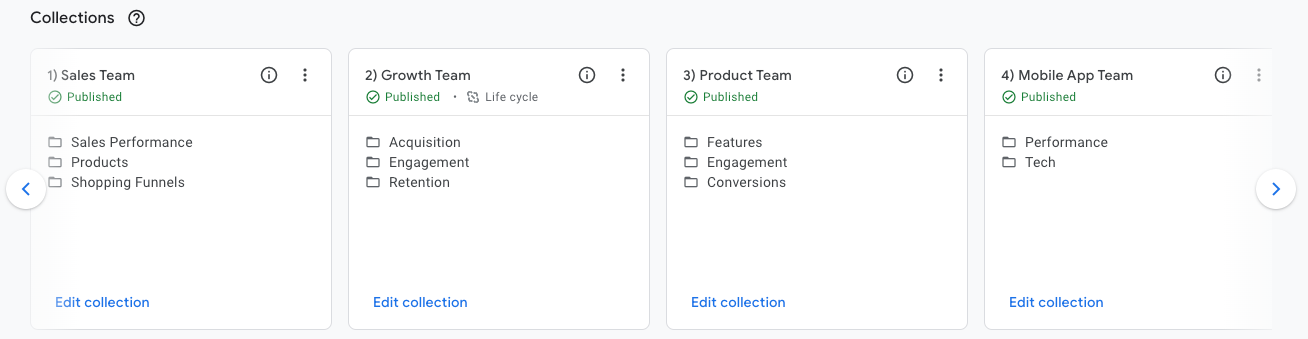
3) Collections
A collection is a set of reports that you and other editors have created. You can create your own collections as well as edit or remove the default collections already provided. The Life cycle and User collections appear in the report navigation by default when a GA4 property is created.
Tips Using Collections:
- Preserve the default collections by unpublishing or making copies to easily “reset” the reporting navigation and reports
- Work within your teams to determine helpful reports and menu structure. The image below shows an example of a structure built for team functions
- Only one overview report per topic
- Keep in mind that you are limited to 7 collections
- Only published collections show up in the navigation
4) Custom Reports
Custom Reports allow you to start building out the structure of your collections with two types of reports: Overview and Detail Reports.
5) Overview Reports
An overview report is a dashboard that summarizes the detail reports in a topic using cards.
Need to Know:
- A topic can have only one overview report
- An overview report can contain up to 16 cards
- Each card created must contain at least one dimension, one metric, and one visualization
- Summary cards are used to build your overview reports but they are sourced from detail reports
6) Detail Reports
A detail report can have up to two visualizations and a table.
Need to Know:
- Can contain report data (dimensions and metrics), charts, a report template, and summary cards
- Linked objects receive updates from Google. If Google adds a dimension to the User acquisition report, the dimension will automatically be added to all linked User acquisition reports
- Report Filters were recently released and we’ve begun seeing them appear in GA4 properties
Creating engaging and meaningful reports within your GA4 property will provoke further questions that lead users down the path of more complex analysis.
Going Beyond GA4 Reports
The streamlined reporting in GA4 will give end users easy access to curated reports, providing key metrics and conversions they love at their fingertips.
Ready to answer more complex questions with your GA4? Here are additional tools to go further with the GA4 interface and beyond.
GA4 is still developing its feature set but you can protect your data by dual-tagging your site with GA4 alongside Universal Analytics. This will provide historical data for you to begin learning more about the reporting and analysis capabilities within GA4.
To learn more about GA4 and dual tagging, watch our GA4 workshop and webinar. Or contact us directly! And keep an eye on our blog—we’ll share more information about GA4 in the coming months.