We are pleased to launch the latest version of the dataLayer Inspector+.
Latest Version
Update Notes: v2024.11.1.1
Due to new restrictions on external script tags in Chrome extensions, the "Insert GTM Container" option has been removed from dataLayer Inspector+. Follow these steps to insert a GTM container into a web page with the "Inject Code" feature instead:
- 1) Go to tagmanager.google.com.
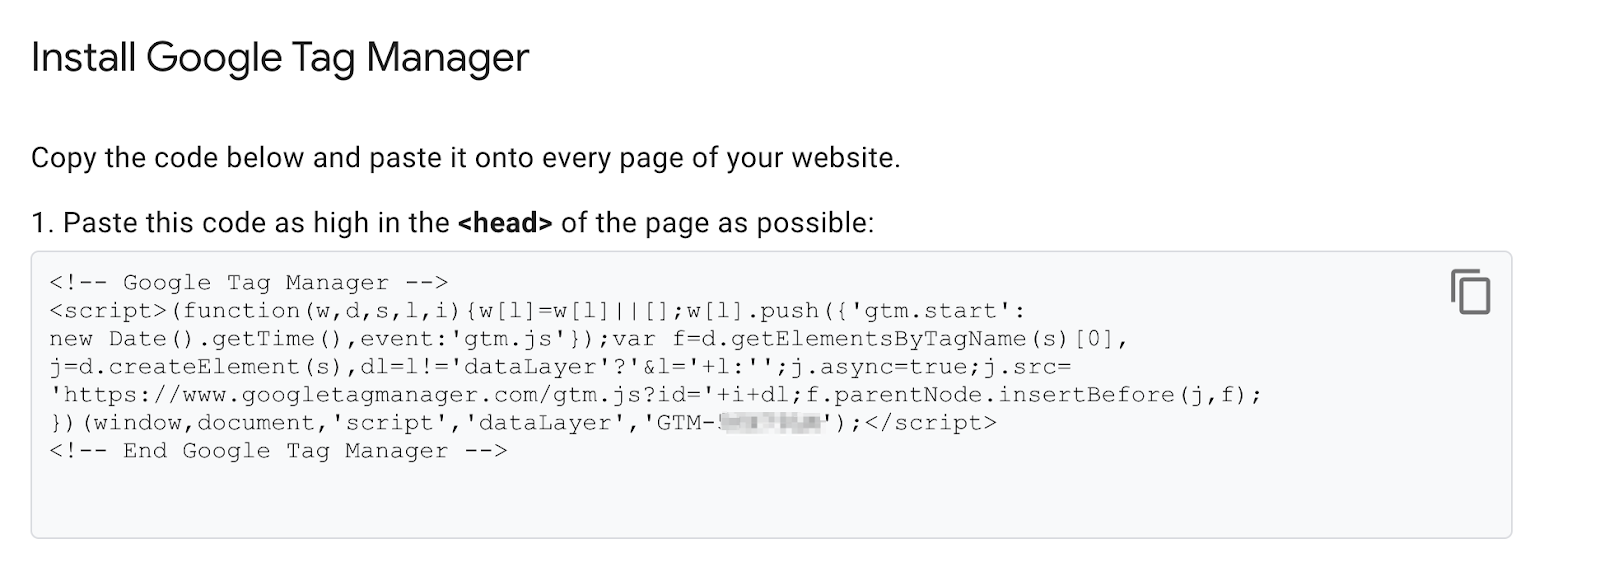
- 2) Under the Admin tab for your container, select "Install Google Tag Manager."
- 3) As shown in the screenshot below, where it says "Paste this code as high in the <head> of the page as possible," copy just the snippet code content. Note: Do not include <script> or </script>, only the code between them.
- 4) In the DataLayer Inspector popup, under "Add Functionality," check "Inject Code."
- 5) Paste the code snippet from Tag Manager into the text box that appears.
- 6) Click the button to "Save Settings & Reload."
The GTM container will be inserted until the "Inject Code" box is unchecked and "Save Settings & Reload" is clicked again. Be sure to do this when you've finished testing.
Overview
What is the Inspector+?
The dataLayer Inspector+ is a Chrome extension that provides real-time, information-rich viewing of data layer activity and Google Analytics hits as they happen in the Developer Tools console. In addition, it has other features that support development and web analytics debugging.
Summary
The UI packs all the features into a compact, easy-to-use set of options.
Add functionality
Provides additional abilities beyond the basic features: e.g., intercept the console (show Inspector+ output when console logging is blocked by a site), push events to the data layer, and add code to the page.

Control output
Enhance or hide outputs: e.g., console highlights, specific events, and specific properties.

Additional options are available under "Control output" by expanding the "Developer Output" submenu. These include Show Mouse Events, Show Timing, Show postMessage, Show Mutations, and Hide Call Stack.
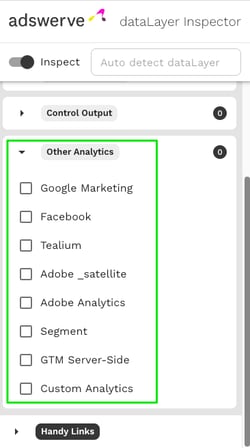
Other analytics
Observe code and network activity for other analytics implementations: Google Marketing, Facebook, Tealium, Adobe DTM, Adobe Analytics, Segment, GTM Server-Side, and Custom.
Handy links
Get links to relevant documentation and resources.

Basic use
The badge will indicate current settings with color and short text.
- On
- Off
- Classic Mode
- dataLayer.push
- Code Inserted
Console output
Banner
HRef
Href is document.location.href at the time the Inspector loads on the page, and could be different from what is in the address bar or what is sent in DL and DP, especially when the page is a Single Page Application (SPA). Shortcut: Clicking on the HRef will take you to the source code in the Sources tab. Similar to right-clicking and selecting View Source, but you can "Pretty Print" the source in the developer tools view.
Referrer
This is document.referrer when the Inspector loads on the page. It may not be the same as seen in the GA hit in the dr parameter. Analytics.js does not include the referrer from the same domain and single page applications Notes: In Single Page Applications (SPA), this banner remains at the top, and the HRef and referrer do not change.
Filter
Use the Tilde (~) to exclude non-Inspector console logs. Make sure you have "All levels" selected.![]()
Collapsed banner
If you'd like to save space in the console, you can select "Collapse banner" in the "Control output" options. This will hide the hint and filter note.
Data Layer Pushes
Anatomy of dataLayer.pushes (and other analytics calls)
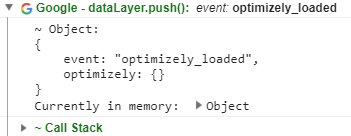
Summary - console.groupCollapsed(...)
![]()
The summary includes a logo, brand, object, function, key and value. If there is no event, and multiple keys, "Object - Expand for details" is displayed.
Details
Each push contains details of the push: e.g., stringified object, pointer to the push currently in memory (it will not be there on the next page when preserve log is checked), and the call stack. When showing timing, it will include seconds to the thousandth since Document Start (when the Inspector was first loaded). Uses: See the stringified content of the data layer push. See evaluations when the Summary is not green. Access the Call Stack. See timing when turned on.
Object Pushed (or Arguments)
The stringified object shows the type of entity pushed to the data layer (Object or Arguments) and a formatted version of the entity (that will be there on the next page, when preserve log is checked, and can be copied and pasted into the console to replay). Use: See the values of the push, even from previous pages.
Currently in memory
This is a link to the actual object in memory. The topmost line is accurate for when the object was pushed to the data layer. When you click on the arrow to the left of the object, (after the colon), the object will expand and an information symbol will display. This indicates that the value of the object was evaluated on the click. Notice that the event value in the top line is different from the second line. This is because the event value was modified after the push and before the click.
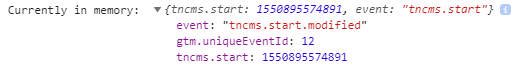
Uses: To see what is in the data layer push when the object is too large or too complex to stringify.
Call stack
Links to the code that executed from the start to the console.log are shown in the expanded "Call Stack." The top links are inside the Inspector+. The bottom link is to the line of code that initiated the push. The link before function [as push], is to the code that called dataLayer.push. Uses: Understanding where the data layer push comes from or what code initiated the push.
Common Data Layer pushes
These pushes are seen on every page when GTM is installed and only once per page. Gotchas: Using these events in a Single Page Application. For example, using gtm.js as a pageview in a SPA will only send a pageview when the page first loads.
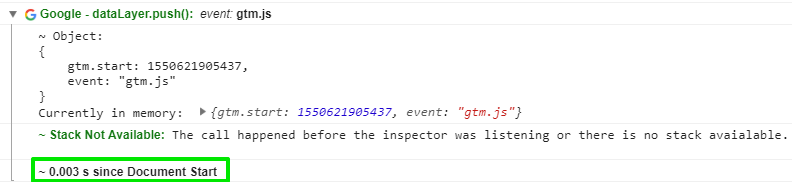
gtm.js
Pushed from gtm and gtag snippets. 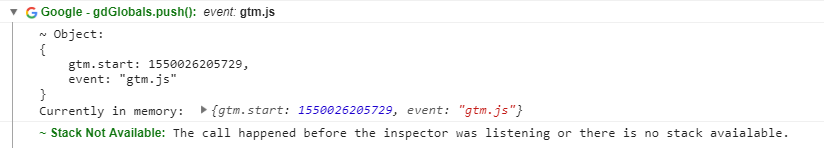
gtm.start is the time the push was made MDN - "the numeric value corresponding to the current time - the number of milliseconds elapsed since January 1, 1970 00:00:00 UTC with leap seconds ignored." The stack is not available when the script runs before the Inspector was loaded.
(function(w,d,s,l,i) {
w[l] = w[l] || [];
w[l].push({
'gtm.start': new Date().getTime(),
event: 'gtm.js'
});
var f = d.getElementsByTagName(s)[0],
j = d.createElement(s),
dl = l != 'dataLayer' ? '&l=' + l : '';
j.defer=true;
j.src= '//www.googletagmanager.com/gtm.js?id='+i+dl;
f.parentNode.insertBefore(j,f);
})(window,document,'script','gdGlobals','GTM-XXXXX');
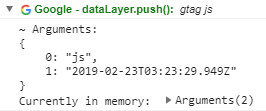
Gotchas: 1. gtag and gtm pushes look different in the data layer, but are seen as the same in GTM. A data layer push from gtag with Arguments containing js and the date/time will be evaluated by GTM the same as the above event: 'gtm.js'
Needed data in the hit that isn't there when the event triggers.
Uses: Understanding when the GTM Pageview is triggered and, when the call stack is available, seeing the code that pushes the event.
gtm.dom
Pushed from GTM when "The DOMContentLoaded event fires when the initial HTML document has been completely loaded and parsed, without waiting for stylesheets, images, and subframes to finish loading." MDN The document object is ready. Uses: When you need to access the DOM.
gtm.load
"The load event is fired when a resource and its dependent resources have finished loading." MDN Gotchas: gtm.load is not a reliable event in some sites, especially publication sites, because resources may load very slowly and sometimes get blocked.
Network hits: anatomy of network hits
Summary
![]()
The summary includes a logo, brand, type and more information. The Google Tag ID appears after the event name. The brand and type are color-coded with three levels: green is good, brown is worth noting and red is an error.
Data sent
The stringified object shows the data sent (that will be there on the next page, when preserve log is checked).

Evaluations
General conventions
Green is good
Pageview hit is valid and contains recommended CD(s)
Brown is a notice
Pushes should have an event key: ![]()
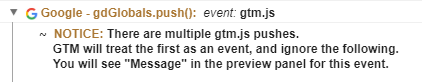
Multiple GTM containers push gtm.js
Snippet not in the head, as per spec ![]()
Red is bad
Duplicate Pageviews, dataLayer resetExamples of evaluations
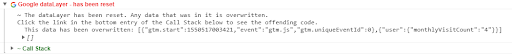
Data Layer Reset
Sometimes, data layers are initialized incorrectly, and after data has been pushed to the data layer. When the data layer has data and is reset using syntax like dataLayer = [], and the Inspector is observing the data layer, you will see the following error in the console. NOTE: This evaluation can only happen if the Inspector+ is observing the data layer at the time of the reset.
document.addEventListener("DOMContentLoaded",(event) => {
    window.dataLayer = [{stuff: 'stuffing'}]
});
GTM Snippet Location
The GTM snippet should be installed in the HEAD element. If it is not, you’ll see a console log of a notice with a link to the script. You can click the arrow to see the script. Right-click on the script to "Reveal in Elements Panel".
![]()
GTM and gtag Configuration Evaluated
These evaluations are in early alpha. The evaluation is done on gtm.load (when all should have been loaded). Sorting through the implementation combinations and the implications is an emerging effort.
![]()
Multiple containers using the same data layer
Multiple GTM Containers
Controls
Inspect
On/off Auto detect dataLayer
Naming the dataLayer can provide better sequencing of pushes and hits
Options
Classic Mode
The Original Version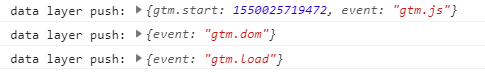
Use: When you feel nostalgic about the simple days of Digital Analytics.
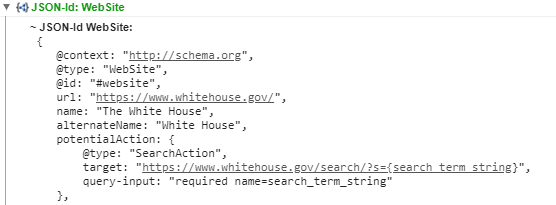
JSON-ld
Add Functionality
-push({})

Pushes an object to the dataLayer (or named data layer) when the Inspector+ is loaded on the page. Usually used when testing GTM and the data needs to be in the data layer asap.
To use, add quoted key (e.g. "event") and value (e.g. "dataLayer-push") pairs with colon in between, separated by commas for multiple sets.
Inject Code
Inserts a script tag into the head. The code will run immediately upon insertion.

Use: When you want to add code to the page immediately or on an event. Hint: To delay until the DOM is ready, use addEventListener: e.g.
document.addEventListener("DOMContentLoaded",(event) => {
// Do your stuff here: e.g. dataLayer.push…
window.dataLayer.push({
event: 'example-event',
stuff: 'stuffing'
})
});
Control output
Collapse Banner
Reduces the space taken up by the banner.
Uses: When you don’t need to be reminded about the console filter: e.g., a tilde(~) excludes non-Inspector+ console messages.
Show Client ID
Appends the client ID (cid) after the property ID of the pageview hit.

Hide Highlights
Turns off the highlights for hits.

Uses: When you don't care if you don't see the hits and the highlights distract you.
Hide specific events
Sometimes developers get verbose with data layer pushes and you may want to ignore one or more events. This uses a Regex match, so you can block multiple events you want with a well-formed regex. Use: Hide data layer push events.
Show hits to a specific property
This will limit the GA output to one specific property. Use: When there are multiple properties and you are only interested in one.
Additional options under "Developer Output"
Show postMessage
Listens to window.message and pushes to the dataLayer the origin, data and the MessageEvent.
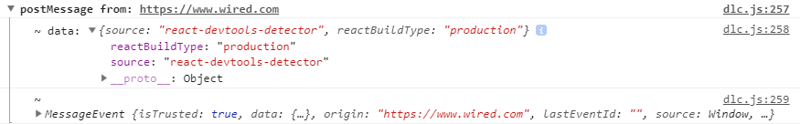
Uses: Communication monitoring from iFrames is a common use case: e.g., cross-domain tracking, video events and ads.
Show Mutations
Sets listeners on the head and body element of the DOM and logs the array of changes when they happen.
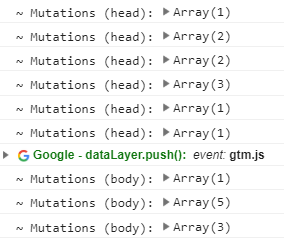
Uses: Answering the questions "What is changing, and when is it changing?"
Hide Call Stack
Does not retrieve and display the call stack in the data layer push details. Use: Declutter the data layer push details.
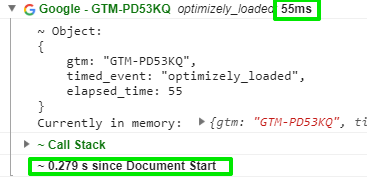
Show Timing
The number of seconds since the document start (when the Inspector+ was first loaded), in thousands of seconds.
Does not retrieve and display the call stack in the dataLayer.push details.
Use: Declutter the dataLayer push details. Show Timing dataLayer.push The number of seconds since the document start (when the Inspector+ was first loaded), in thousands of seconds.
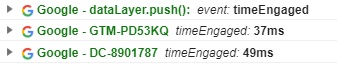
Use: Measure how long it takes for an event to happen or the duration of tag processing: push processing time. The number of milliseconds the code takes to process the push; from push to callback.
NOTE : Both gtag and GTM process data layer pushes.
Other analytics
Google Marketing
Floodlight and other Google Marketing hits are displayed in the console.
Adobe _satelite
Adobe's legacy tag management system, Dynamic Tag Manager, is being replaced by Launch. The feature is early Alpha, meaning it’s incomplete and may not be reliable.
Adobe Analytics
Like Google Analytics, Adobe sends tracking hits to their own platform. The Inspector+ will monitor the hits and display them in the console similarly to how GA hits are displayed. The feature is early Alpha, meaning it’s incomplete and may not be reliable.
Tealium
This is a tag management system (TMS) that is agnostic to the analytics platform. The inspector monitors view and link calls and displays the calls in the console, similarly to data layer pushes. This feature is in advanced beta and is planned to be released to the public.
Like Google Analytics and Adobe, Facebook sends hits to their own platform. Like GA and Adobe hits, these are displayed in the console.
Custom Analytics
This feature will add a "monkey patch" to a function on an object and when the function is called, it will log to the console something similar to dataLayer.push. Examples: window.addEventListener, dataLayer.push
A common question
Why does the dataLayer.push NOT expand when clicked?
This is usually due to the console filter either having something other than a tilde (~) or when the levels are too strict.
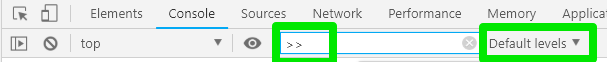
Remedy: Use the tilde (~) for a filter and select "Default levels".