
There’s a lot to like about Data Studio. It’s intuitive, easy to access, simple to share and covers most of the visuals you might need for a dashboard. And it’s free! It’s a natural entry point for creating visuals and reports on top of your BigQuery data warehouse.
But you’re not reading this to hear what you already know about Data Studio. You’re likely reading because you’re curious about other reporting workflows, specifically via Looker.
Comparing Data Studio and Looker isn’t an apples-to-apples comparison. Data Studio is a free visualization tool. Looker is a paid data platform and has a broader range of capabilities. It offers a fundamentally different approach to creating reports (which I’ll discuss later).
I don’t want to overload you with excruciating details, so instead, I’ll outline some high-level Looker advantages and you can determine whether it’s something worth pursuing further.
The Infamous Reporting Bottleneck
As mentioned above, Data Studio is mostly a visualization tool. If your BigQuery data isn’t prepared to connect to a report, then a SQL practitioner needs to shape the source data into flat tables that fit your desired analysis.
Now I’m not saying Data Studio is so complex that business users can’t create their own tables and visuals. They definitely can. But the data they need must at least be available in the data source. If the underlying data is based on a custom query in BigQuery and is missing a field the user needs, you’ll need to make a request.
In many organizations, the volume of requests from business users often exceeds the bandwidth of the typically smaller group of SQL practitioners.
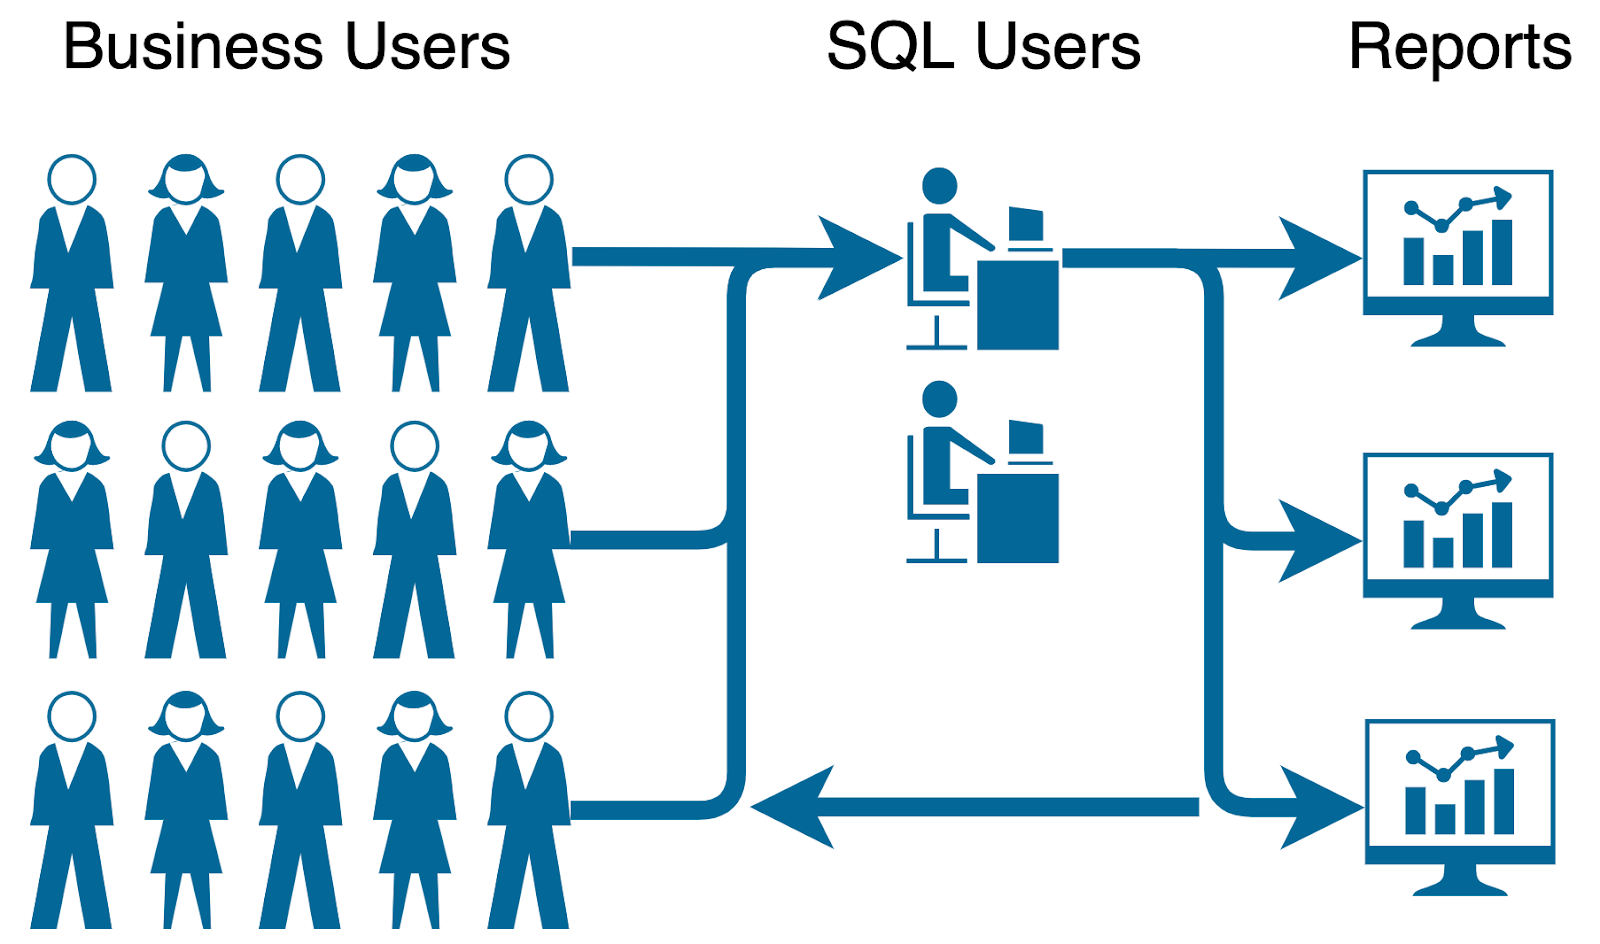
This ultimately results in long wait times for fulfillment and is overwhelming for the SQL practitioners.
This is a situation that Looker helps alleviate, and it has to do with the platform’s fundamentally different approach.
Self-Service Business Intelligence
The first thing you should know about Looker is that the platform is designed to automatically generate complex SQL for the user based on what fields they select. This happens seamlessly behind the scenes of course, but you can always take a peek at the SQL if you’d like.
Once Looker has established a connection with your database, a Looker admin user defines some key details about the tables/fields you want in your data model:
- Define which columns are dimensions
- Define your calculated metrics
- Designate which dimension is unique for every row
- Describe table relationships and join keys
This is done with LookML (Looker Model Language), a proprietary “language” for describing your model and customizing how you want Looker to handle and present your data to users.
With those basic items defined, non-admin users can simply choose fields they need from all the available dimensions and metrics, even across multiple source tables, and the SQL will be created and run to produce their desired results.
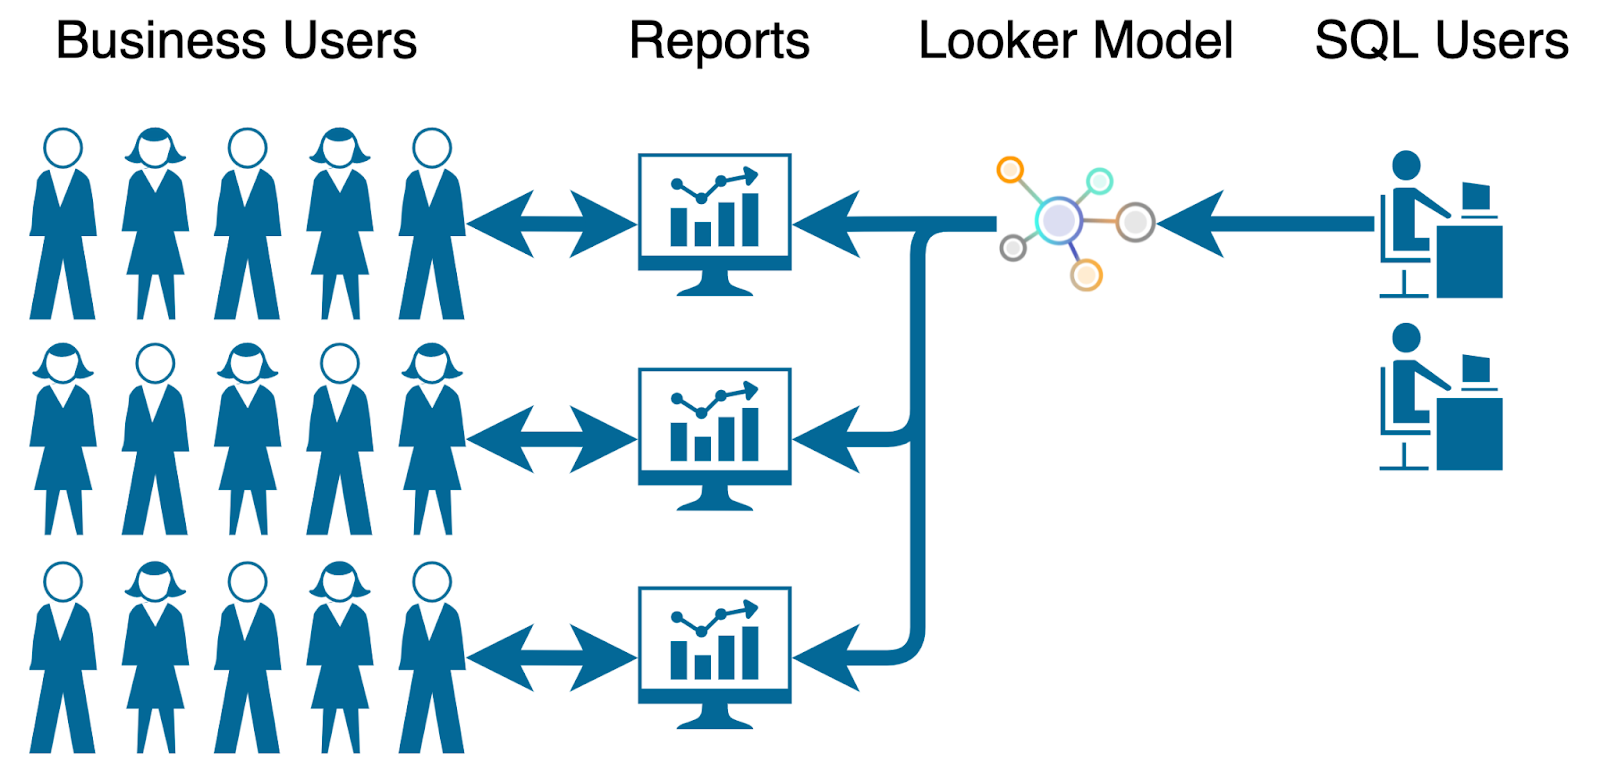
This creates a more self-service business intelligence workflow. The Looker admins in your organization build a LookML model on top of your tables in BigQuery. Your users get what they need when they need it.
Don’t Repeat Yourself
Don’t repeat yourself (DRY) is a software development principle that essentially encourages programmers to reduce repetition and redundancy in their code.
In early programming languages, you constantly had to worry about low-level tasks like handling memory. Languages have continually evolved to do those repetitive tasks in the background and let programmers just focus on writing code.
LookML aims to be that next iteration that prevents analysts from continually having to write and rewrite the same or similar SQL queries.
Now, a Looker model may still require some SQL, depending on the model complexity. But imagine if the admins only had to define the model once and were able to stop repeating similar work every time a coworker needed a slight variation of what they’d previously built. This is time back to those employees, and your organization, to focus on more important tasks.
Data Governance
Let me see if this scenario is familiar…
Your organization has dozens of Data Studio reports, many that report on the “same” data from BigQuery. However, you end up with reports that:
- have different naming conventions for the same fields
- have calculated fields with different formulas
- are missing critical fields
- turn out to not even be connected to the right table in BigQuery
This happens in Data Studio because data sources are embedded in the specific report in which they were created by default. Users with edit access may customize the source fields however they like. Even if multiple reports connect to the same table in BigQuery, the Data Studio data sources can vary wildly.
This could result in multiple reports viewed by your organization having two different values for the same metric. This erodes trust in the data and can deter would-be data users.
Now, Data Studio does have an option to make reusable data sources where multiple reports essentially share a single data source. This can help with these problems, but you’ll need to constantly police who has edit access and whether reports are using the “definitive” data sources.
If you feel like this scenario is an area where your organization struggles, Looker can add that much-needed level of data governance.
In LookML, you define an “Explore”, similar to a Data Studio data source, as a set of dimensions and metrics from a BigQuery table (or set of joinable tables). This Explore then serves as the single source for your Looker users to report on those fields. All Explores are easily accessible from a drop down in the Looker UI for business users to select and begin data exploration or building dashboards.
Let’s say a user has built a dashboard with the field “Net Adjusted Revenue” and Looker admins decide to modify this field calculation a few months later. The modification will be represented in the dashboard as soon as the admins publish the changes.
Having a platform where your data models are centralized standardizes data across reports and gives data consumers more confidence in the data they’re being presented.
Column-Level Restriction
You want to make a Data Studio report for users to do some data exploration on a table in BigQuery, but there are a few sensitive columns you don’t want some users to access.
In order to do this, you have to make a version of the BigQuery table without the sensitive fields, and make two Data Studio reports, each with a different data source connecting the appropriate table. You’ll need to share the reports with their respective groups and restrict outside report sharing.
To achieve this in Looker, an admin would mark those sensitive columns as only being available to users with X user attribute, then fill in that attribute for the users in the user section.
Going forward in Looker, restricted users will still have access to the same Explore, but just without the restricted columns. Even if an unrestricted user were to send a restricted user a report that displays the restricted columns, the restricted user would be unable to view them.
Row-Level Restriction
You want to restrict users to only be able to see rows that pertain to them. Maybe they’re individual performance metrics, or maybe you just want them to see a region/group they’re in.
Data Studio has a means to do this, but the data must contain a user’s email address in order to present only that row. This can be tedious to add this to your data, especially if multiple users need to see the same rows because you have to duplicate that row for each email. Not ideal.
In Looker, an admin can designate that if a certain column contains certain values, users with certain user attributes can’t see them. You don’t need to add new data to the underlying source table to make this work.
So if you're finding that fine-tuning user access is something your organization might be interested in, but have felt it’s been too clunky to manage in Data Studio, then you’ll love Looker’s more streamlined and centralized process.
Other Cool Stuff
Apart from the standard business intelligence improvements over Data Studio, Looker has some other cool features that enable you to create some unique data projects.
Looker API
Need to expose data from Looker outside of the UI? Looker has a rich API that lets you pull the data you need and integrate into any custom application.
Embedded Analytics
Maybe you want to give users Looker’s data exploration capabilities in an employee portal, partner portal or on your website. You can embed Looker’s UI into a webpage and customize guard rails on data access based on the user.
Data Actions
These are customizable actions that a user can initiate directly from the data. Either by clicking on a specific field, an entire query output, or at the dashboard leve, a user can choose from a list of tasks to perform with that data. They can range from changing the underlying data in a field or sending a templated email to a client to uploading a data import to Google Analytics—or any action you can think of that your developers can code.
The LookML Caveat
If you’re considering migrating to Looker, you should know that LookML can take some time to learn. The structure of language itself isn’t particularly difficult. It’s basically a series of object-like key value pairs, but it’s still a modelling language nonetheless. There’s going to be a bit of a steep learning curve to know how it all affects the model output.
But think of it as a long-term investment. The time spent for a few (or one) of your employees to level up their LookML skills will open up a new, hopefully better, data experience for your organization.
Conclusion
Data Studio is a fantastic product and I personally enjoy using it. And for many companies, whether due to their size, data culture or data engineer to data consumer ratio, it can be the perfect tool that meets their needs. This article isn’t meant to discourage using the tool in any way.
However, some organizations may want a different data experience from the one Data Studio provides. So if any of the pain points I mentioned above resonated with you and a more centralized, self-service type of data platform sounds intriguing, then I urge you to take a deeper look. Adswerve recently earned our Looker Certified Consulting Partner status, and we’re happy to help you explore how Looker can be a solution for your needs. Just contact us for more information.