Share


BigQuery MachineLearning (BQML) can train and serve ML models using SQL to power marketing automation and help deliver personalized experiences.
Article Series Overview
In this series we’ll use unsupervised machine learning methods to build clusters of users grouped by their similarities. Then we’ll analyze these clusters to extract insights and add meaningful business labels to better understand them. Next, use the Data Import API to load the clusters into Google Analytics (GA) to turn them into segments, and finally, we’ll build GA Audiences to activate the users across the Google Marketing Platform. We began by introducing the idea of how to “Use BQML to Activate Audiences on Google Marketing Platform (GMP)” in Part 1 of this article series. Next, we covered "Data Preperation." Part 3 will now dive into Modeling.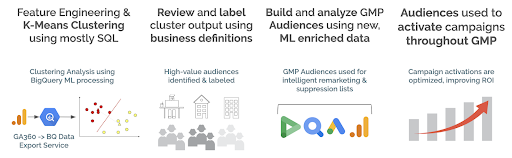
Technologies Used:
- Google Cloud
- Google Marketing Platform
Modeling & Tuning
 If you’re building an ML model for the first time, you can skip the
previous two articles
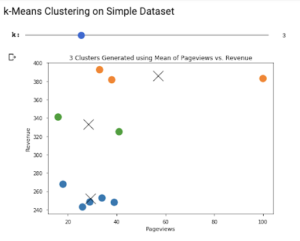
and begin here. We’ll build a complete model in only a few steps. First, we’ll use a simple clustering example then move on to a more robust solution.
The previous articles are important for an analyst who’s responsible for continuously delivering predictions to their organization and for creating the pipeline to manage that process.
If you’re building an ML model for the first time, you can skip the
previous two articles
and begin here. We’ll build a complete model in only a few steps. First, we’ll use a simple clustering example then move on to a more robust solution.
The previous articles are important for an analyst who’s responsible for continuously delivering predictions to their organization and for creating the pipeline to manage that process.
BigQuery ML K-Means Clustering
We’ll use BigQuery ML to build a k-means model that can be used to automatically segment users after being trained on historical data. The model learns from the past to make predictions about the future. Let’s begin with a simple example:CREATE or REPLACE MODEL `blog.ga_clusters_example` OPTIONS ( model_type='kmeans', num_clusters=3 ) AS SELECT FIRST_VALUE(channelGrouping) OVER (PARTITION BY fullVisitorId ORDER BY visitStartTime) as first_channel, SUM(totals.pageviews) AS pageviews, SUM(totals.totalTransactionRevenue / 1e6) AS revenue FROM `bigquery-public-data.google_analytics_sample.ga_sessions_201612*` GROUP BY fullVisitorId, channelGrouping, visitStartTime HAVING revenue between 0 and 500The above query generates three columns of data: first_channel, page views and revenue. Since a single user can generate multiple sessions, we need to GROUP BY fullVisitorId as this ensures each row represents a single user. In clustering, you want the rows to represent single entities with potentially many columns (dimensions) summarizing that entity. Some of the more astute ML practitioners will notice that channelGrouping is categorical. Normally, ML models need all inputs to be numeric. Fortunately for us, BQML automatically handles preprocessing steps like standardization and one-hot encoding . This is a wonderful feature. BigQuery ML includes many time-saving features that make it possible to manage your ML models exclusively using SQL. Using the CREATE MODEL syntax , we train a k-means model to look for three clusters of the given input query. We use the OPTIONS fields to customize the model; in this case using the only two required fields for a k-means model: model_type = 'kmeans' , num_clusters = 3
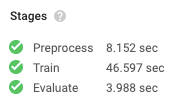 Once the training is complete, we can see that BigQuery went through each ML processing stage in under a minute. In total, BigQuery spent eight minutes of CPU time to build this model and billed us for 4MB of usage. At a rate of $250 per terabyte used in model creation, our current bill is $0.001: 4 MB / 1e6 * $250 = $0.001
The model took six training iterations to reach a minimal loss and finish. Inspecting our model, we get information about the means, or centroids, found within each cluster. Reviewing this data will show us how the users (rows) were clustered and what makes them different from each other.
Once the training is complete, we can see that BigQuery went through each ML processing stage in under a minute. In total, BigQuery spent eight minutes of CPU time to build this model and billed us for 4MB of usage. At a rate of $250 per terabyte used in model creation, our current bill is $0.001: 4 MB / 1e6 * $250 = $0.001
The model took six training iterations to reach a minimal loss and finish. Inspecting our model, we get information about the means, or centroids, found within each cluster. Reviewing this data will show us how the users (rows) were clustered and what makes them different from each other.
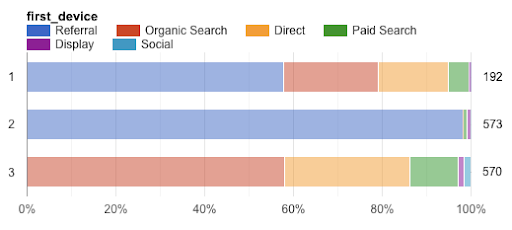
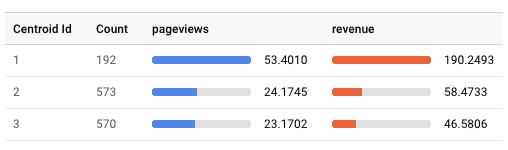 Our model assigned 1,335 users to three different clusters, shown as Centroid Id. Our first cluster was a smaller group, only 192 of the total users, but had higher average pageviews and revenue than the other two clusters. This is our “high-value” cluster.
The remaining clusters aren’t very different from each other in terms of page views and revenue. There’s a third dimension available for analysis — the categorical field “first_channel” — and we can see that the second and third clusters are differentiated by this column:
Our model assigned 1,335 users to three different clusters, shown as Centroid Id. Our first cluster was a smaller group, only 192 of the total users, but had higher average pageviews and revenue than the other two clusters. This is our “high-value” cluster.
The remaining clusters aren’t very different from each other in terms of page views and revenue. There’s a third dimension available for analysis — the categorical field “first_channel” — and we can see that the second and third clusters are differentiated by this column:
 In a manner of speaking, we have learned what the machine learned. This is significant because the machine analyzed far more data points than we would have been able to ourselves. In some cases, this validates your own understanding or can reveal patterns you never knew existed. Powerful stuff indeed!