There are two different models of paying for BigQuery analysis: flat-rate, which is being replaced by editions, and on-demand. In this article, I will focus on the on-demand cost model, but the practices described apply to both models.
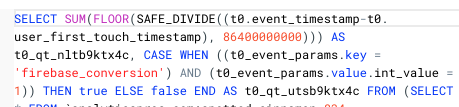
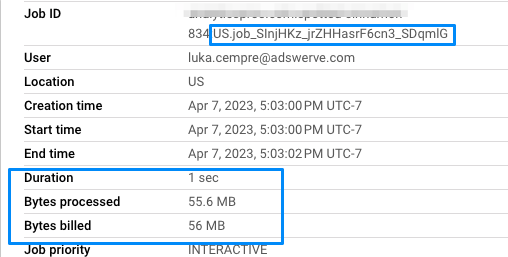
The easiest way to see the impact of your visualization tools on BigQuery processing is to review your personal history or project history in BigQuery. Queries from outside services, such as Looker Studio, are usually easy to spot as they use distinct syntax and job ids. Just like with queries run in the UI, you can see their speed (duration) and associated cost (bytes billed).
Sharded Tables
When working with sharded tables, take full advantage of BigQuery's table suffix. Table suffixes will most often have a useful meaning and may even be replicated in the table as a column. To optimize your connection with Data Studio, expose the suffix and give it an alias.
Bad Example
A custom query that feeds Looker Studio by using all of the date sharded tables and then filtering by an attribute called date.
SELECT
  event_date,
  event_name,
  user_pseudo_id,
  (SELECT value.int_value FROM  unnest(event_params) WHERE key = "ga_session_id") as sessionId
FROM analytics_1234567.events_*
Fix it by moving _table_suffix to the SELECT statement and using it as a date attribute.
SELECT
	_table_suffix as event_date,
	event_name,
	user_pseudo_id,
	(SELECT value.int_value FROM unnest(event_params) WHERE key = "ga_session_id") as sessionId
FROM analytics_1234567.events_*
| Duration | Bytes processed (cost) | |
| Bad Example | 23 seconds | 1.51 GB |
| Good Example | 1 second | 67.1 MB |
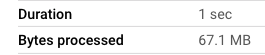
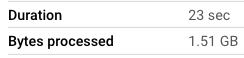
We are not only selecting considerably fewer rows (31 out of 800 tables), but we are also getting rid of an expensive string column and replacing it with a "free" metadata column (extracted from the table name). This makes the above query over 22.5 times cheaper and faster as well. Now your reports will cost less and load much quicker.
*Looker Studio is smart enough to connect to the raw events tables using the _table_suffix in the WHERE clause, but be careful as this may not be a default behavior for other sharded tables and other business intelligence tools may not have those capabilities.

Reporting tables
Build reporting tables that get updated on an interval. For most visualizations, it makes sense to connect to pre-aggregated tables. Instead of having similar widgets query against a raw table, you will often find common denominators and should be able to build a reporting table. Reporting tables can either be updated on a certain time schedule or by an event (such as an update to the base table). When building larger reporting tables make sure to also take advantage of clustering and partitioning.
Clustering
Take advantage of clustering when dealing with high cardinality attributes that you expect to filter by in your reports. This will not only help with reducing the amount of data scanned when filters are used but will also speed up the reports. You can use multiple fields when configuring clustering.
Partitioning
Partitioning splits the table into smaller segments and can only be used on a single field of the table. Partitioning in BigQuery can be done by an integer, time or date and can be combined with clustering to optimize your queries further.
Example:
|
1
2
3
4
5
6
7
8
9
10
11
12
13
|
CREATE OR REPLACE TABLE `Reporting_Dataset.mar_sessionsStarts_by_day_loc`PARTITION BY dateCLUSTER BY country, region ASSELECT PARSE_DATE("%Y%m%d", event_date) as date, geo.country, geo.region, countif(event_name = "session_start") as session_starts FROM `analytics_12345678.events_202303*`GROUP BY 1,2,3 |
Materialized Views
Materialized views are defined by a query just like traditional SQL views but cache their results to increase performance and the need to scan data from the base table. Traditional (incremental) materialized views work really well with streamed data because of their ability to focus and calculate the delta between the current and the most recent request and add it to the already cached total.
As you will notice from the example below, you can also use clustering and partitioning with materialized views.
|
1
2
3
4
5
6
7
8
9
10
|
CREATE MATERIALIZED VIEW `luka_tables.live_sessionsStarts_by_loc_MV2`CLUSTER BY country, regionASSELECT geo.country, geo.region, countif(event_name = "session_start") as session_starts FROM `analytics_209734898.events_intraday_20230407`GROUP BY 1,2 |
Because querying the materialized view only scans new data since the last update/run, BigQuery will only scan the most recent data and thus significantly decrease the cost and speed up the query significantly.
You can adjust background refresh times to increase performance for views not queried as frequently and staleness to sacrifice some of the real-time metrics for additional cost savings and speed.
Since materialized views rely on incremental increases of aggregated metrics, the allowed SQL does come with certain limitations. Cannot use a wildcard or dynamic values like current_date().
Non-Incremental
Google has recently introduced non-incremental materialized views. Which allows the usage of additional SQL clauses, such as JOINs, UNIONs, and analytics functions. The difference, as the name suggests, is that this version of materialized views does not depend on deltas. The underlying data is refreshed in its entirety when requested. Non-incremental materialized views can serve as a good alternative to more traditional reporting tables.
BI Engine
BI Engine improves the performance of your report with its in-memory analysis service that lives on top of BigQuery. You can adjust the size of the BI Engine according to your needs from 0 to 250GB. The cost per GB is $30.36 per month.
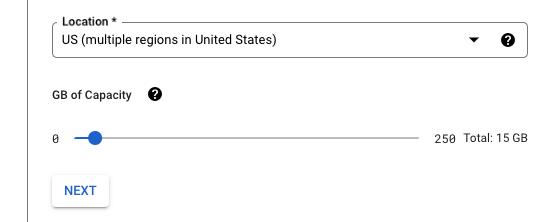
BI Engine also works with other services such as Tableau, Looker, Power BI, and other custom applications.
Looker Studio Caching
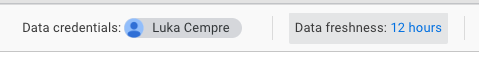
Looker Studio will automatically cache values for individual widgets for a specific set of dimensions, metrics, date ranges, and filters. If any of those change, Looker Studio will have to run a new query on the data source.
A default data freshness setting for BigQuery data source is 12 hours.
If you have questions about your BigQuery and Looker Studio connection, please feel free to reach out to our experts. We are always happy to help. In the meantime, you can review the resources below for more info.