You may have noticed that the Google Analytics 4 UI is phasing out many of the previously available attribution models, and defaulting to data-driven attribution. Don’t panic. You can still continue using classic attribution models that you've known and loved or even create your own custom ones by utilizing the power of the GA4 BigQuery export feature.
Attribution modeling assigns credit to various marketing channels or touchpoints along the conversion path. In this article, we will discuss and implement some of the most frequently used rule-based attribution models using the GA4 BigQuery export.
Sample Session Table
Let's start with a sample session table that we'll use to demonstrate different attribution models and then use SQL on the GA4 BigQuery export to implement different rule-based attribution models.
| Marketing Channel | Interaction # | Date of Visit | User Id | Conv. Id |
| Organic Search | 1 | May 22, 2023 | Luka | 123 |
| Paid Search | 2 | Jun 3, 2023 | Luka | 123 |
| Paid Search | 3 | Jun 3, 2023 | Luka | 123 |
| Organic Search | 4 | Jun 4, 2023 | Luka | 123 |
| 5 (conversion) | Jun 5, 2023 | Luka | 123 | |
| Direct | 1 | Jun 2, 2023 | Charles | 124 |
| Organic Search | 2 (conversion) | Jun 4, 2023 | Charles | 124 |
The interaction number starts from 1 with a first interaction within the 30-day lookback window (more in "About the Lookback Window) from the conversion date. Each line is associated with the corresponding conversion that users' sessions lead to
Base Query
To make our lives easier, we will replicate the table above using the GA4 export with a few additional "helper" fields and then build different attribution modeling algorithms on top of it.
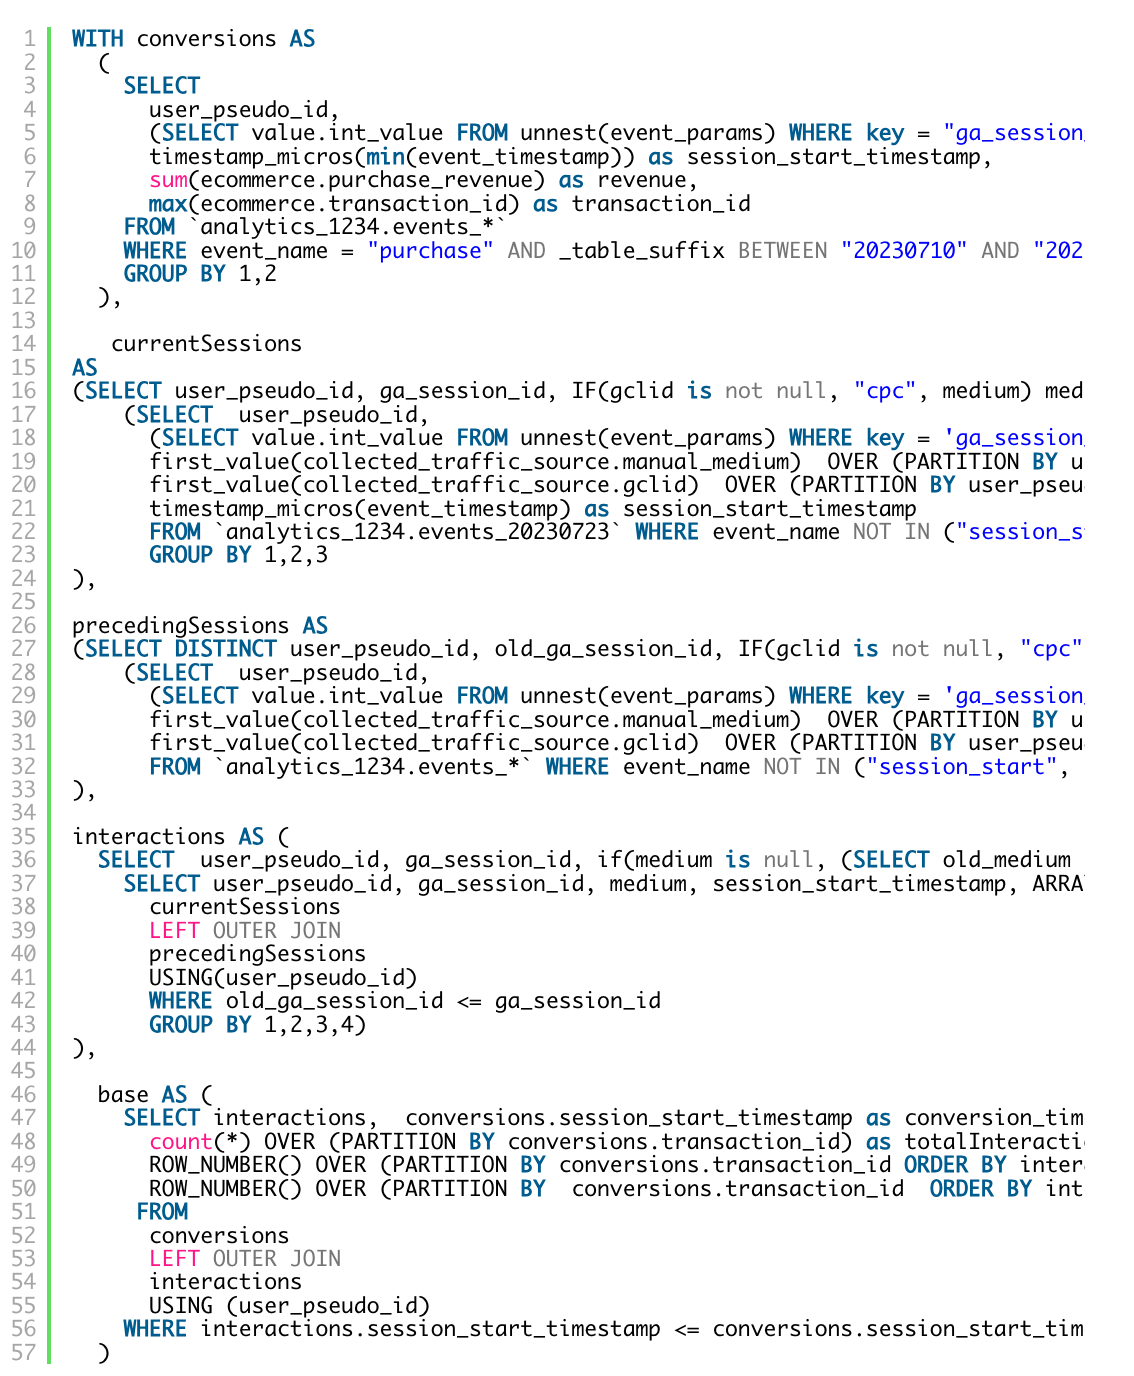
*Getting traffic source information in the GA4 export to match that in the UI is not a straightforward process. I will dive into the steps to get as close as possible in a future blog post.
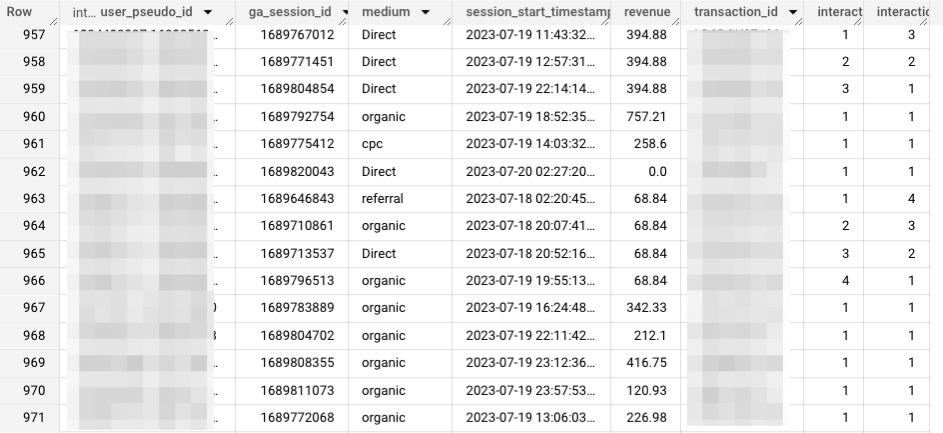
The output includes a 30-day window of historical sessions for each transaction by the user. Each row also has information about the session id, medium, session start time, revenue (of the eventual conversion), transaction id, interaction number and interaction number in descending order.
About the Lookback Window
When dealing with attribution, you should always determine a lookback window, which can differ from business to business. A lookback window will limit the interactions to only those that happened in a certain time period before the conversion (30-day window).
Just as with everything else BigQuery allows you to completely customize this aspect as well. So instead of setting it to a static 30 days, why not use a dynamic lookback window such as:
- maximum time between two interactions - if they visited 32,31 and 30 days ago, why would the interaction 30 days ago take credit, but the other two not?
- different length based on the time of the year - maybe you are running a seasonal business, and users aren't even able to convert certain times of the year?
- different length based on a product - it takes a lot longer to buy a car than to buy a deodorant, why treat them the same?
Last-Touch Attribution Model
The last-touch attribution model is arguably the easiest one, the whole value of a conversion is accredited to the last interaction from the user. Even though the sample table has 4 marketing channels that led users to convert, Email and Organic Search would each take full credit for conversions of their respective users (Luka and Charles)
Paid Search = 0
Direct = 0
Email = 1
Organic Search = 1
Using our base query this is a pretty simple problem to solve, all we have to do is limit ourselves to last interaction or interactionNumber_desc=1.
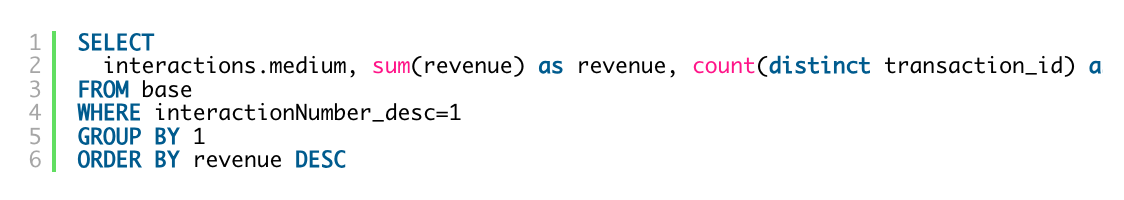
If we were dealing with the last-touch attribution model alone, we could’ve skipped the base query and simply look at the medium at the time of conversion.
First-touch Attribution Model
The first-touch attribution model credits the whole conversion to the first interaction in the lookback window before the transaction occurred. If a user has a single interaction, or all interactions come from the same medium (or dimension of your choice) it will attribute values identical to last-touch attribution. First-touch attribution can be thought of as a "discovery" - what brought a user to the site?
In our "Sample Session Table" Direct and Organic Search would each get a credit.
Paid Search = 0
Direct = 1
Email = 0
Organic Search = 1
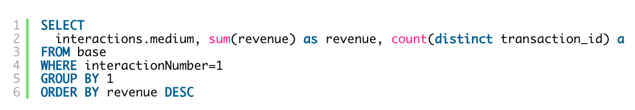
Compared to the last-touch attribution we can simply switch the interactionNumber_desc to interactionNumber = 1 looking at only user's first interactions.
Linear Attribution Model
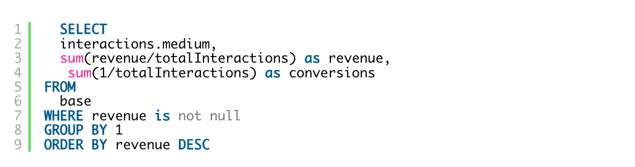
The linear attribution model treats all the touchpoints equally; if there were 5 interactions leading to a transaction, each interaction would take 1/5 or 20% of the credit.
In our Sample Session Table above, each interaction from the transaction 123 gets 20% and each interaction from 1234 gets 50% of its credit.
Paid Search = 0.4 (0.2 + 0.2)
Direct = 0.5
Email = 0.2
Organic Search = 0.9 = 0.2 + 0.2 + 0.5
Make sure to check your algorithm once the rules become a bit more complex. The total credit assigned should always match across all algorithms and sum up to the total of the metric you're tracking.
To implement this, we will simply divide the interactions of each transaction by the total number of interactions in each session (totalInteractions).
Position-Based Attribution Model (40-20-40)
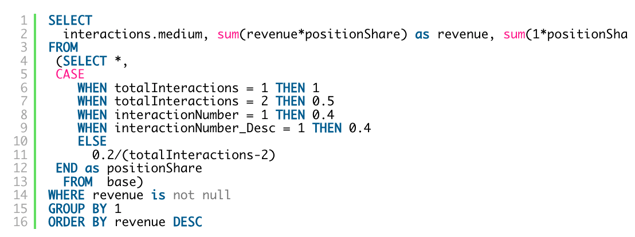
Position-based is one of the most commonly used models among marketers. You could say that it's quite fair to credit 40% of the conversion to the first (discovery) interaction, and 40% to the last (converting) interaction. Interactions in the middle divide the remaining 20% equally. In the two edge cases without "middle" interactions, a single interaction conversion will assume 100% of the credit and when a conversion consists of two interactions, each will assume 50% of the credit.
In our Sample Session Table above, interactions from transaction id 123 get 40% for the first and last and 20/3 = 6.67% for each in the middle. Because the second transaction only has 2 interactions, each gets 50%.
Paid Search = 0.133 = 0.067 + 0.067
Direct = 0.5
Email = 0.4
Organic Search = 0.967 = 0.4 + 0.067 + 0.5
When turning the algorithm into SQL we simply add a positionShare field, which calculates the position attribution share for each interaction based on the rules described above.
Decay Attribution Model (7-day halving)
The decay attribution model builds on the theory that the older the interaction is, the less important it becomes. In our case, we will say that the importance of interaction drops by half every seven days.
If each interaction on the day of the conversion is worth x, then a conversion that happened two days earlier (in our sample transaction id 124) would be worth x*0.5^(days_ago/7) = 0.82*x. Meaning the most recent interaction would be worth 1/1.82*1 = 0.55 and the first interaction would be worth 1/1.82*0.82 = 0.45.
For transaction 123 we follow the same formula: 1 + 0.5^(1/7) + 0.5^(2/7) + 0.5^(2/7) + 0.5^(14/7) = 3.796, which makes the interactions' share (most recent to least) worth 0.26 (1/3.796), 0.24, 0.215, 0.215, 0.07 for a total of 1.
Paid Search = 0.24
Direct = 0.55
Email = 0.285 = 0.215 + 0.07
Organic Search = 0.925 = 0.26 + 0.45 + 0.215
When turning the above algorithm to SQL, I used minutes instead of days to add a bit of precision. First, we calculate the absolute decay values using the following formula "POW(0.5, (TIMESTAMP_DIFF(conversion_timestamp, interactions.session_start_timestamp, MINUTE)/(7*24*60))) decayShare_PN" in the outer query we then normalize decay values to sum up to one for each transaction and then use those shares on conversions and revenue.

Final Results and Thoughts
| Last Touch | First Touch | Linear | Position | Decay | |
| Paid Search | 0 | 0 | 0.4 | 0.133 | 0.24 |
| Direct | 0 | 1 | 0.5 | 0.5 | 0.55 |
| 1 | 0 | 0.2 | 0.4 | 0.285 | |
| Organic Search | 1 | 1 | 0.9 | 0.967 | 0.925 |
As you can see the differences between attribution models can be quite significant, often the best approach is to consider multiple and try to figure out what the combination of models may be telling you. Most often, you will see channels like email performing far better in the lower end of the funnel favorited by last touch attribution. But to get to an email channel, users usually have to sign up for newsletters, register, etc. To get there, they need to discover your site (the upper funnel) via a different channel, such as Organic Search.
A common practice is that a team responsible for a marketing channel will pick the model that represents them in the best light. In the majority of cases, an email marketer will look a lot better using last-touch vs. a first-touch attribution mode, whereas the situation may be the opposite for your SEO specialist.
There is no right or wrong attribution model, but there definitely are right and wrong interpretations of their outputs. Even with many different approaches, the rule-based attribution models are just the start of the world of conversion credits. Adding machine learning, data-driven attribution, path analysis, MMM, Markov chain attribution, and other approaches only makes things more interesting and complex, but may bring you closer to finding that perfectly fair revenue distribution across your channels.
The complete code is available on Adswerve's GitHub.
More GA4 BigQuery Tips from Luka:
- Blog: Users and Sessions
- Blog: Event Parameters and Other Repeated Fields
- Blog: Four Different GA4 Traffic Flavors in the BigQuery Export
At Adswerve, we offer a range of services to help you get the most out of BigQuery and GA4. Reach out to learn more!