Data Studio is a free visualization tool with a drag-and-drop interface that helps you connect your own data sources to quickly create interactive dashboards.
The ability to personalize reports has become a must-have feature in visualization tools. It allows an individualized view of reports by filtering the underlying data with a viewer’s parameter. In the case of Data Studio, we can utilize the logged-in viewer’s email address.
Data Studio has two approaches that allow you to take advantage of report personalization:
- Using the "filter by email" function
- Using email parameters in a custom query
The Native Filter by Email Method
Preparing the Data Source
Filter by email needs to compare the user's email to a value within your data source. This method uses an exact comparison, which means that your data source will require a column with full email address values that are in the same format (casing, dots) as viewers'.
Filtering uses a "row-level data security" approach. This means that for each data source only rows with an exact match to the viewer's email will be used to generate the dashboard. If you would like to display certain rows to more than one or a group of users, you will have to utilize a join outside of Data Studio or take advantage of data blending. For more advanced options, you should also consider using an email parameter in a custom query.
Setting up the Filter
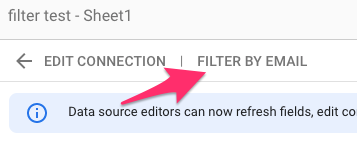
To set up the filtering, navigate to the "FILTER BY EMAIL" option in the Data Source editor.
Once you enter the "FILTER BY EMAIL" option you will need to select the attribute that stores the email values (all attributes from your data source will be displayed).
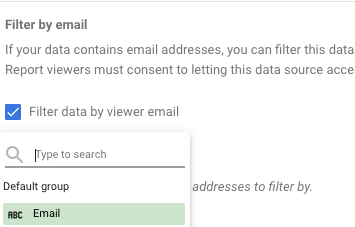
Select the attribute and you’ll see that the report data is filtered.
The Report
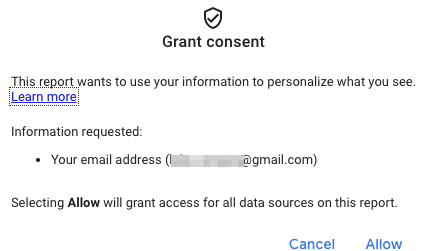
Since Data Studio will access the viewers’ email addresses to filter the underlying data, users will be greeted with a prompt to grant access for all data sources to access their email on their first visit.
THE EMAIL PARAMETER VIA A CUSTOM QUERY METHOD
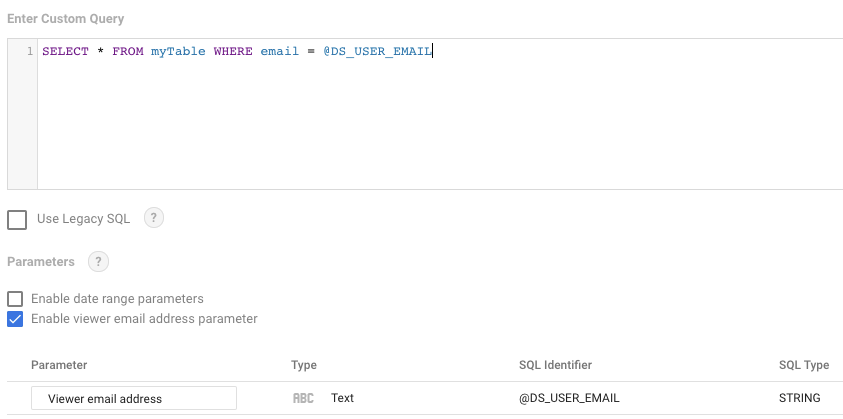
Another way to personalize your Data Studio report uses email parameters. When connecting your dashboard to BigQuery, you can use Data Studio User Email (@DS_USER_EMAIL) as a parameter in your custom query. This allows you to use viewer’s email in a very similar manner as we’ve seen with the previous approach, but also allows you to get a bit more sophisticated.
You can enable the viewer email parameter in the custom query config view and then use it in queries as @DS_USER_EMAIL. Note that the parameter does not require quotation marks around it and will be treated as a string.
Filtering by domain Example
For this use case, we want to create a visualization for a number of our clients that will be accessed by many members of their teams. To simplify maintenance, offer all our clients the same experience, and stay nimble with changes and updates, we decided to use a single Data Studio dashboard. However, we will filter the data displayed based on the viewer domain (all companies use their own domains for employees’ Google Accounts).
We first need to add a domain attribute to the data schema.
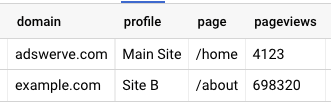
Now, via a custom query (BigQuery data source), we can extract the domain from the viewer's email and use it in the match.
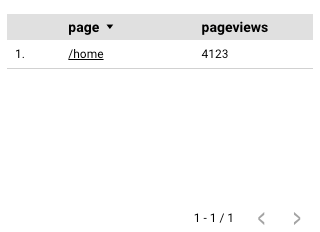
[source lang="sql"] SELECT * FROM `projectId.datasetId.domain_filtered` WHERE domain = SPLIT(@DS_USER_EMAIL, "@")[offset(1)] [/source]Data Studio is now ready to generate dashboards based on what domain viewer's email belongs to.
Other Use Cases
There are several reasons you’d want to personalize Data Studio reports, including ensuring that:
- Employees can look at their own productivity (in company performance dashboards)
- Managers only get access to review the productivity of their team
- Individual contributors can review their article performances in Google Analytics (by mapping author custom dimensions to their email)
- Departments can review their own KPIs
- Groups/individuals can compare their own numbers against the totals or benchmarks
- All clients (based on their domain) can access their real-time billing data in Data Studio in one dashboard
Hopefully, this helps you take full advantage of your Data Studio reports or think of new ways to use your reports. If you want to dive deeper, I’ve included some resources below. And, as always, feel free to contact our team with any questions.