
Share


Previous period and year-over-year (YoY) metrics have little meaning in this COVID-19 world. Instead, you can use forecasting tools to quickly quantify the effect that COVID-19 is having on your important metrics. Knowing this value can help you prioritize your response and measure the effectiveness of those efforts.
Facebook Prophet is an excellent tool for this scenario. I have created a
Google Colaboratory Notebook
that you can use to follow along with this blog article and customize using your own data and use case.
View the Google Colaboratory Notebook
.
View the Github Notebook
.
 You can run the query and then
↓ Skip to bottom
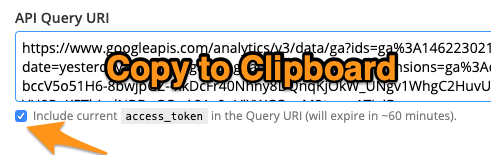
to get to the API Query URI field. Be sure to check the
Include current
access_token
in the Query URI
checkbox, then copy that field to your clipboard.
You can run the query and then
↓ Skip to bottom
to get to the API Query URI field. Be sure to check the
Include current
access_token
in the Query URI
checkbox, then copy that field to your clipboard.
 The trained eye can detect patterns in visualization, but we need to add some value to our analysis before the boss is impressed. Our goal is to train a model using this historical data in order to use that model to make predictions about a future that never happened.
In our reality, COVID-19 happened. When you were planning your budgets for 2020, COVID-19 did not happen. We need to reconcile your plan with the new reality and this analysis technique can help you measure the impact on important business metrics.
The trained eye can detect patterns in visualization, but we need to add some value to our analysis before the boss is impressed. Our goal is to train a model using this historical data in order to use that model to make predictions about a future that never happened.
In our reality, COVID-19 happened. When you were planning your budgets for 2020, COVID-19 did not happen. We need to reconcile your plan with the new reality and this analysis technique can help you measure the impact on important business metrics.
 This is the FB Prophet
plot_components()
API, and it is the reason I love FB Prophet so much. These models reveal your business patterns and make them easy to understand.
In order to use this model for prediction, we simply take the date, ie. 7/1/2018, then add all the components together to form our prediction. July is a bump for us, +10 for simplicity. That was a Sunday, -15. No holiday effect, +0, and finally, it was on the left-hand side of an upward trend, +5 points. Add that together, 10 + -15 + 0 + 5, and our prediction is zero (0).
If we do that again for a different date, ie. 4/15/2020, April is also popular, +15. That is a Wednesday, +10. No holiday on that date, and it was on the right-hand side of an upward trend, +20 points. Add these together and we predict 45 goal completions for that future date.
This is the FB Prophet
plot_components()
API, and it is the reason I love FB Prophet so much. These models reveal your business patterns and make them easy to understand.
In order to use this model for prediction, we simply take the date, ie. 7/1/2018, then add all the components together to form our prediction. July is a bump for us, +10 for simplicity. That was a Sunday, -15. No holiday effect, +0, and finally, it was on the left-hand side of an upward trend, +5 points. Add that together, 10 + -15 + 0 + 5, and our prediction is zero (0).
If we do that again for a different date, ie. 4/15/2020, April is also popular, +15. That is a Wednesday, +10. No holiday on that date, and it was on the right-hand side of an upward trend, +20 points. Add these together and we predict 45 goal completions for that future date.
 We can run this analysis for many of our metrics, giving us visibility into signals that are otherwise buried in noise. This technique creates a derived aggregation of your metrics, "COVID Impact", in which we see the cumulative effect of the difference between the forecast and actual.
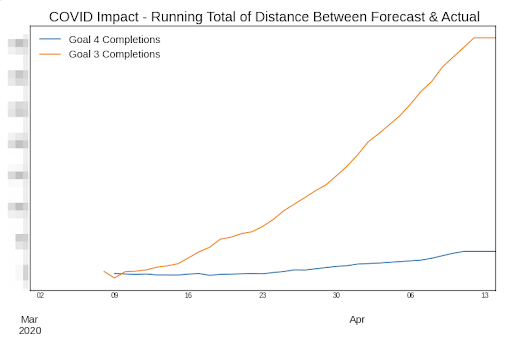 Knowing this helps us prioritize our response and focus on our efforts where appropriate. We hope that your teams are faring well during this time of crisis. Hopefully, this analysis will be helpful, and of course, we always appreciate feedback so please
reach out to us
with questions, comments, and concerns, and let’s keep the conversion moving forward!
Knowing this helps us prioritize our response and focus on our efforts where appropriate. We hope that your teams are faring well during this time of crisis. Hopefully, this analysis will be helpful, and of course, we always appreciate feedback so please
reach out to us
with questions, comments, and concerns, and let’s keep the conversion moving forward!
COVID-19 Impact Analysis
Using Facebook Prophet & Google Analytics Query Explorer The premise is simple. Take a single metric, ie. transactions, goal1Completions, etc., and collect the time series vector using the GA Query Explorer, in order to predict a future that never happened, then evaluate our reality against that prediction. The difference between reality and the forecast is the "total COVID-19 impact" metric; a derived metric used to better understand and manage your business planning and response. To keep the code simple, I'm following a technique demonstrated by Silver Ringvee on the Reflective Data blog . You'll just need access to a Google Analytics account to be able to follow along!Analysis Steps:
Step 1: Constructing an API Query URI
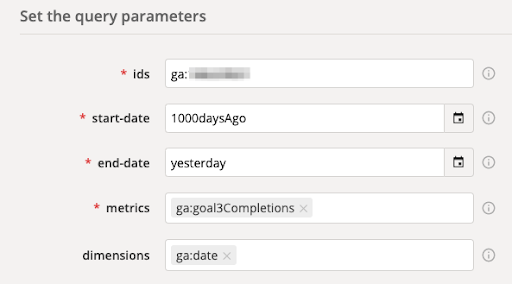
Our example uses a simple interface to query Google Analytics using its v3 Core Reporting API . Google has built a tool to construct an authenticated query that will return dimensions and metrics for up to 1,000 rows of data! Link to GA Query Explorer: https://ga-dev-tools.appspot.com/query-explorer/ After selecting an account, property and view, we'll need to configure the report settings. We set the start-date to 1000daysAgo to make the most of the simple tool. Don't worry if your metric doesn't have 1,000 days of history. The end-date is set to yesterday . To build a time series, we need one metric grouped by one dimension: date. On Adswerve.com, we have a goal that tracks the number of folks that touch the "Contact Us" page (shown below as ga:goal3Completions ). You might have a similar goal or event on your website that tracks an important business metric.
You can run the query and then
↓ Skip to bottom
to get to the API Query URI field. Be sure to check the
Include current
access_token
in the Query URI
checkbox, then copy that field to your clipboard.
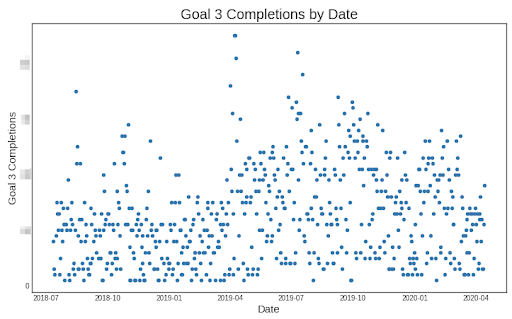
Step 2: Running the Query URI and Inspecting Results
When you paste this URI into the Colab Notebook cell, you’ll get a brief preview of the results:
The trained eye can detect patterns in visualization, but we need to add some value to our analysis before the boss is impressed. Our goal is to train a model using this historical data in order to use that model to make predictions about a future that never happened.
In our reality, COVID-19 happened. When you were planning your budgets for 2020, COVID-19 did not happen. We need to reconcile your plan with the new reality and this analysis technique can help you measure the impact on important business metrics.
Step 3: Generate a Model using Facebook Prophet
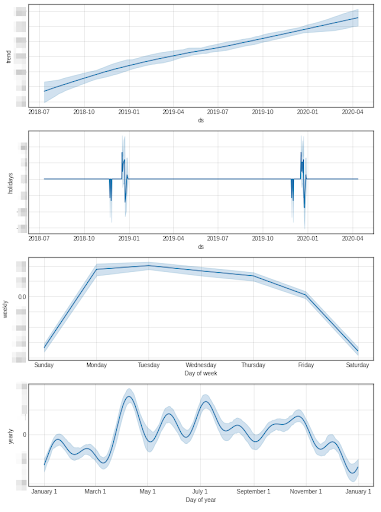
Facebook Prophet takes a time series and generates a model. This model is typically an additive seasonal model. The patterns found in daily, weekly and yearly seasonality make up the model, plus a polynomial trend is calculated and finally, a special holiday model is applied.
This is the FB Prophet
plot_components()
API, and it is the reason I love FB Prophet so much. These models reveal your business patterns and make them easy to understand.
In order to use this model for prediction, we simply take the date, ie. 7/1/2018, then add all the components together to form our prediction. July is a bump for us, +10 for simplicity. That was a Sunday, -15. No holiday effect, +0, and finally, it was on the left-hand side of an upward trend, +5 points. Add that together, 10 + -15 + 0 + 5, and our prediction is zero (0).
If we do that again for a different date, ie. 4/15/2020, April is also popular, +15. That is a Wednesday, +10. No holiday on that date, and it was on the right-hand side of an upward trend, +20 points. Add these together and we predict 45 goal completions for that future date.
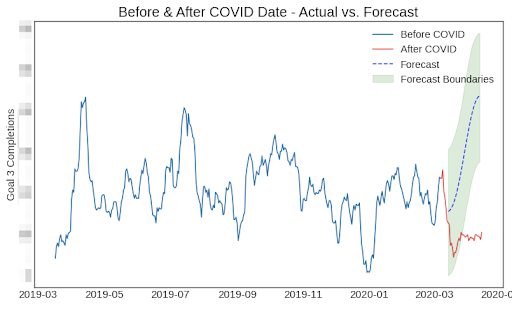
Step 4: Predict a Future that Never Happened
The trick to this analysis is that we only let the model train on data prior to an arbitrary "COVID" start date. For Adswerve, we started seeing the most obvious effect begin around March 8th, 2020, so that is our cut-off date. Having the model trained on data not corrupted by the virus, we can overlay actuals against the forecast and get an informative result:
We can run this analysis for many of our metrics, giving us visibility into signals that are otherwise buried in noise. This technique creates a derived aggregation of your metrics, "COVID Impact", in which we see the cumulative effect of the difference between the forecast and actual.
Knowing this helps us prioritize our response and focus on our efforts where appropriate. We hope that your teams are faring well during this time of crisis. Hopefully, this analysis will be helpful, and of course, we always appreciate feedback so please
reach out to us
with questions, comments, and concerns, and let’s keep the conversion moving forward!