
Share


Google Analytics has a lot of data—no surprises here! And although the standard reports cover a lot of ground in understanding how users interact with your site, sometimes there are specific things you want to know. And of course, our favorite analytics tool has the ability to customize reports in the way that you need, but with this much variety, sometimes what you get isn't what you expect.
This blog post will cover some of the most common reporting problems we have come across when working with Google Analytics - Part Two!
If you're interested in Part One, follow this link!
 If you want to know what Custom Tables are, read this Google Support article:
https://support.google.com/analytics/answer/2774517?hl=en
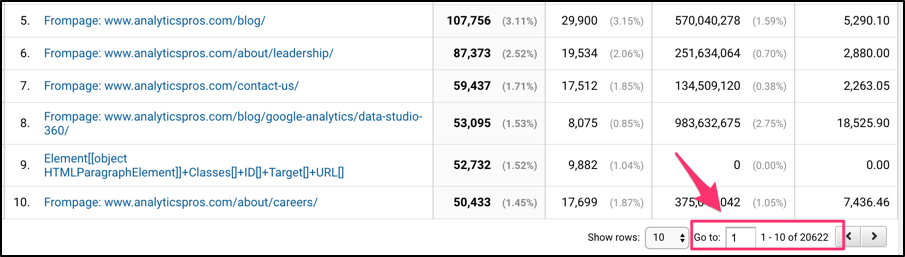
The number of rows, or unique dimensions, available in a report is located on the bottom right of the tables in the pagination option.
If you want to know what Custom Tables are, read this Google Support article:
https://support.google.com/analytics/answer/2774517?hl=en
The number of rows, or unique dimensions, available in a report is located on the bottom right of the tables in the pagination option.
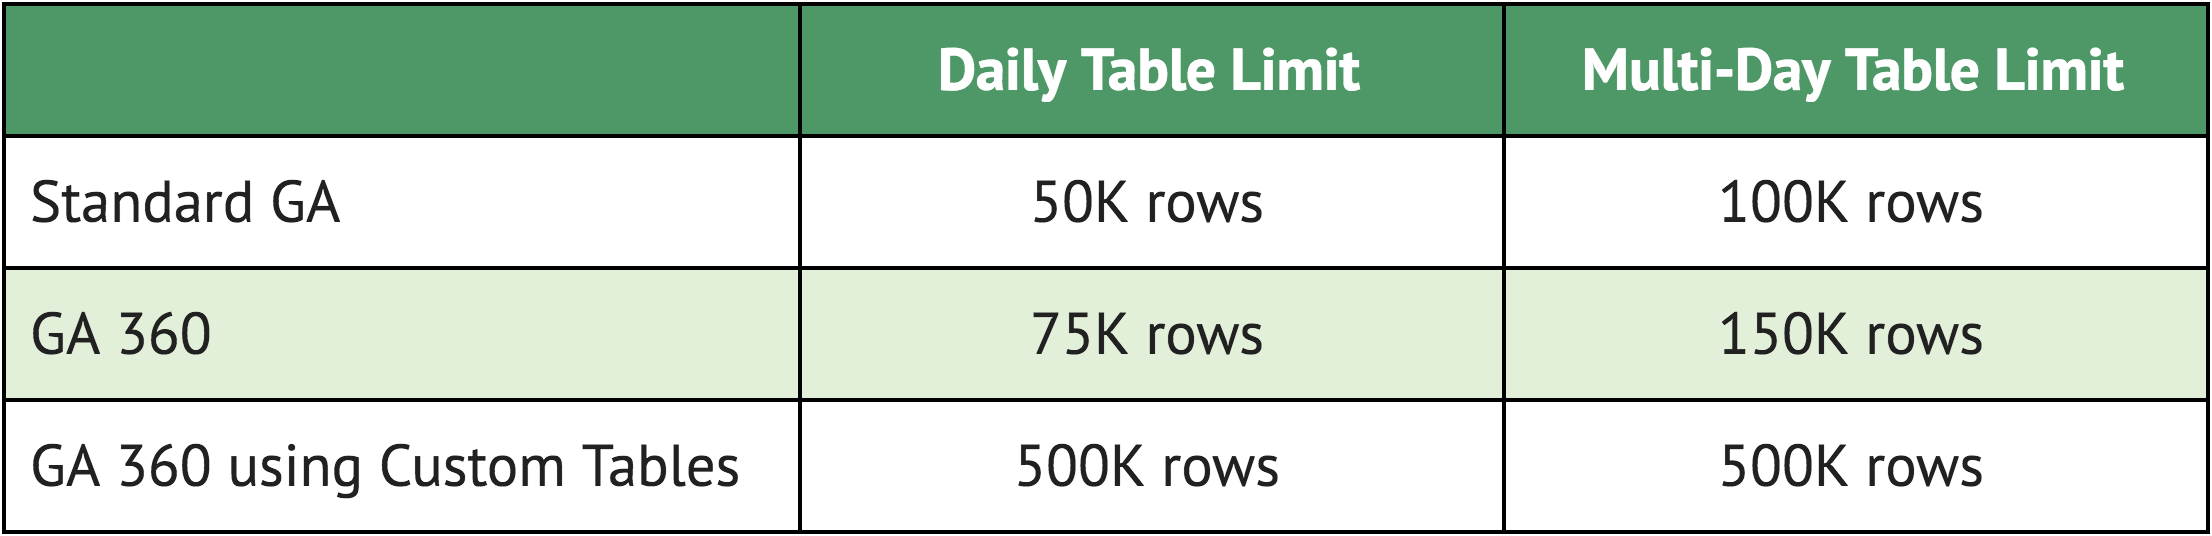
 When the number of rows rises above 75,000 in a single day, or over 150,000 when looking at data across multiple days, Google Analytics will consolidate the rows with the lowest primary metrics.
For example, if we received pageviews on 76,000 different pages in a single day, the pages that ranked 75,0001 to 76,000 would be consolidated into one row and the value of that dimension would be (other). This behavior is an example of report sampling due to high-cardinality. This simply means that there is a very high number of unique values for a particular dimension, which in this case, results in some entries being bucketed together into the one value, in this case “(other)”.
How to Fix:
Short-term solutions include…
When the number of rows rises above 75,000 in a single day, or over 150,000 when looking at data across multiple days, Google Analytics will consolidate the rows with the lowest primary metrics.
For example, if we received pageviews on 76,000 different pages in a single day, the pages that ranked 75,0001 to 76,000 would be consolidated into one row and the value of that dimension would be (other). This behavior is an example of report sampling due to high-cardinality. This simply means that there is a very high number of unique values for a particular dimension, which in this case, results in some entries being bucketed together into the one value, in this case “(other)”.
How to Fix:
Short-term solutions include…
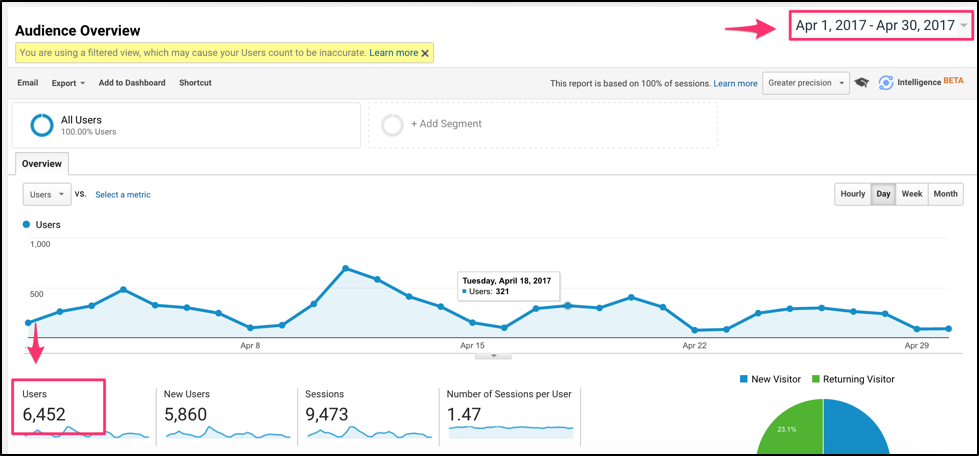
 When the date range is changed to April 1st to April 30th, 2017, the reported metric is 6,452:
 Now, when the date range is changed to include March 1st, 2017 through April 30th, 2017, only 12,555 users are recorded:
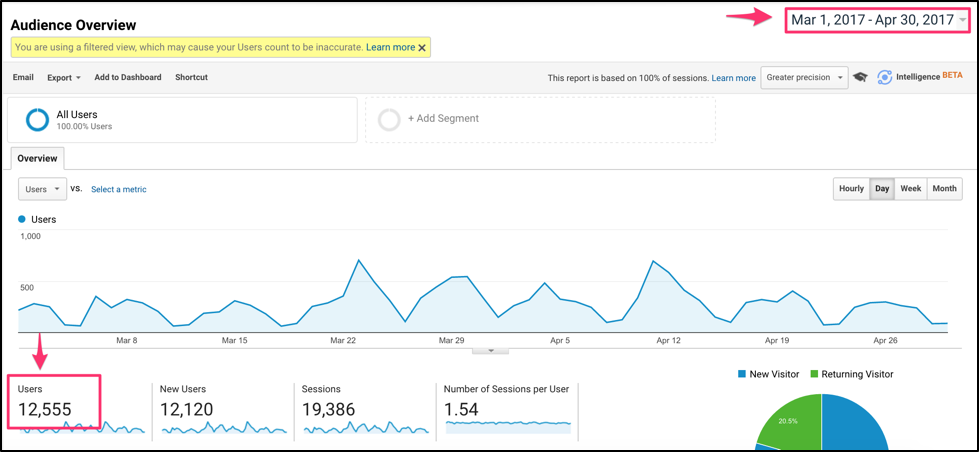 Why isn’t that number greater? This is because the users metric is calculated specifically for the time period of the report. Since users are maintained by GA over time, the number of users in December and January will include many of the same users.
When reporting on users in Google Analytics, be
very
careful to not sum up the number of users across months (in this example, 6,668+ 6,452 = 13,120 and
not
12,555). Especially for sites that have a higher percent of Returning Users, this metric variance between summed and actual can become even greater.
How to Fix:
Why isn’t that number greater? This is because the users metric is calculated specifically for the time period of the report. Since users are maintained by GA over time, the number of users in December and January will include many of the same users.
When reporting on users in Google Analytics, be
very
careful to not sum up the number of users across months (in this example, 6,668+ 6,452 = 13,120 and
not
12,555). Especially for sites that have a higher percent of Returning Users, this metric variance between summed and actual can become even greater.
How to Fix:
 The difference between the screenshots is that the second one has a segment of "Direct Traffic" applied to it. The calculation from the raw tables can be seen here as the reported number of users from the pre-aggregated tables is 63,628 and from the raw tables 63,521. As of May 2017, Google Analytics currently does not expose that reports are sampled when using the raw data to create new joined tables.
However, when a certain date range includes over 100 million sessions, and an ad hoc query such as an applied segment, secondary dimension, or advanced filter is requested, then will Google Analytics expose that the report is sampled.
The difference between the screenshots is that the second one has a segment of "Direct Traffic" applied to it. The calculation from the raw tables can be seen here as the reported number of users from the pre-aggregated tables is 63,628 and from the raw tables 63,521. As of May 2017, Google Analytics currently does not expose that reports are sampled when using the raw data to create new joined tables.
However, when a certain date range includes over 100 million sessions, and an ad hoc query such as an applied segment, secondary dimension, or advanced filter is requested, then will Google Analytics expose that the report is sampled.
 How to Fix:
E. I see "(other)" in my report
The value “(other)”, while similar in appearance to “(not set)”, carries a different meaning. In reports, when the maximum row limit is exceeded, Google Analytics consolidates those dimensions by the lowest primary metrics. Reports are subject to the following row limits:
If you want to know what Custom Tables are, read this Google Support article:
https://support.google.com/analytics/answer/2774517?hl=en
The number of rows, or unique dimensions, available in a report is located on the bottom right of the tables in the pagination option.
When the number of rows rises above 75,000 in a single day, or over 150,000 when looking at data across multiple days, Google Analytics will consolidate the rows with the lowest primary metrics.
For example, if we received pageviews on 76,000 different pages in a single day, the pages that ranked 75,0001 to 76,000 would be consolidated into one row and the value of that dimension would be (other). This behavior is an example of report sampling due to high-cardinality. This simply means that there is a very high number of unique values for a particular dimension, which in this case, results in some entries being bucketed together into the one value, in this case “(other)”.
How to Fix:
Short-term solutions include…
- Use a smaller date range
- If you are a 360 user, create an Unsampled Report
- If you are a 360 user, create a Custom Table in order for GA to select the dimension/metric combinations you need into an unsampled table.
- Ensure best practice filters are set (e.g. lowercase request URI, events, campaign information)
- Update Google Analytics settings to remove query parameters (and pass them as custom dimensions if they are important for analysis)
- Update Google Analytics settings to strip search queries out of the URL (and configure View-level settings to preserve the value from the search parameter for Site Search reports)
F. I see "n/a", "null", or other values which do not have any meaning in my report
If there are values such as "n/a", "null", or other values which are meaningless in your report, they are likely populated this way by the data source. "(not set)" and "(other)" are the only values that GA will set without data. All other values are actual values which have been passed in. How to Fix: Verify that the source of data is sending the data appropriately.- Is the data point populated from a Data Import?
- Verify values are imported correctly
- Are the data points populated from the website?
- Verify values are sending from the website correctly
G. My users are showing different numbers for different date ranges
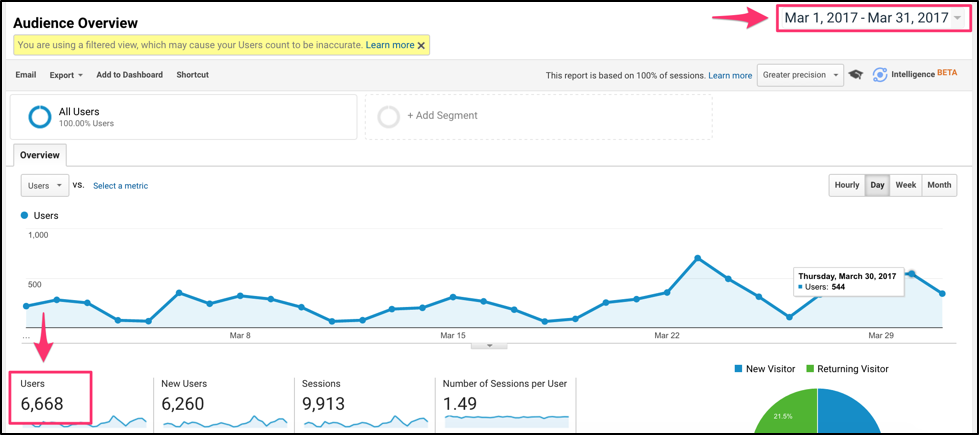
This is specifically related to how Google Analytics reports users. For example, when viewing the Audience overview report for the data range of March 1st through March 31st, 2017, Google Analytics reports 6,668 users:
When the date range is changed to April 1st to April 30th, 2017, the reported metric is 6,452:
Now, when the date range is changed to include March 1st, 2017 through April 30th, 2017, only 12,555 users are recorded:
Why isn’t that number greater? This is because the users metric is calculated specifically for the time period of the report. Since users are maintained by GA over time, the number of users in December and January will include many of the same users.
When reporting on users in Google Analytics, be
very
careful to not sum up the number of users across months (in this example, 6,668+ 6,452 = 13,120 and
not
12,555). Especially for sites that have a higher percent of Returning Users, this metric variance between summed and actual can become even greater.
How to Fix:
- If reporting on users across date ranges, use the larger date range and don't sum users over different date ranges
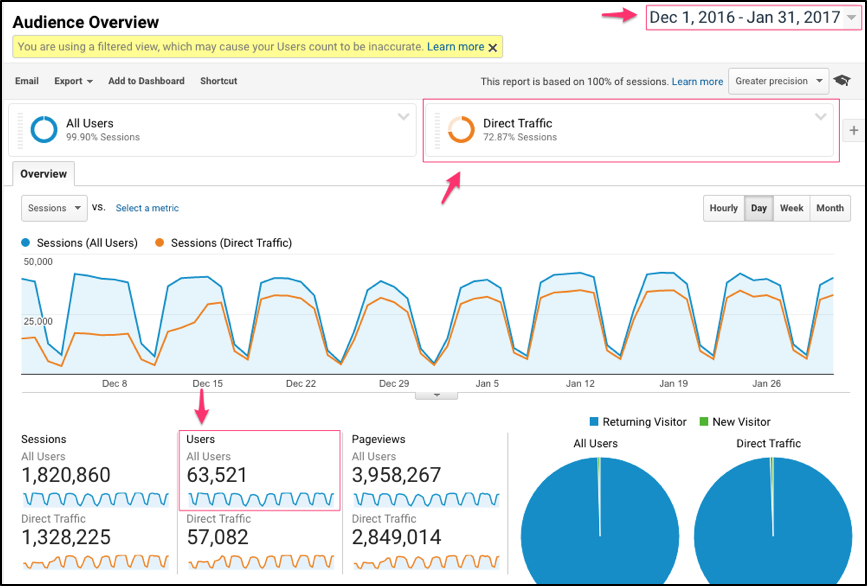
H. My metrics are different when a segment or filter is applied
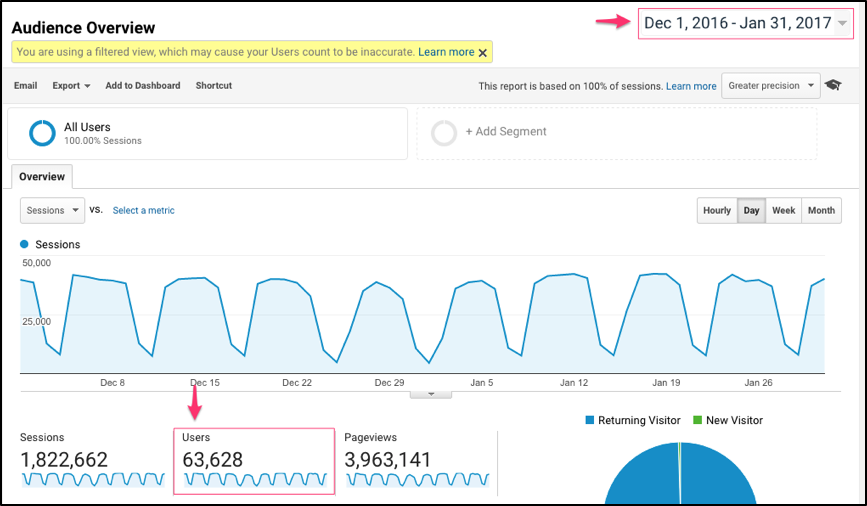
The two common issues in this section have the same root cause—the way Google Analytics stores and processes data. There are two places where data is stored. The first area is the pre-aggregated tables. For the dimensions and metrics available in standard reports and overviews, Google Analytics will store these pre-aggregated, for example, the number of sessions, users, or pageviews in a given date range. The second place Google will store data is in raw tables. This is done so Google can support any ad-hoc queries thrown it's way. For example, creating a segment to see Sessions from a specific custom dimension value asks Google Analytics to access the raw data to create a new joined table to surface this information. Google Analytics does not process this data in its normal daily processing, so the pre-aggregated tables cannot be used here. The below screenshots show this happening - note the similar date range:
The difference between the screenshots is that the second one has a segment of "Direct Traffic" applied to it. The calculation from the raw tables can be seen here as the reported number of users from the pre-aggregated tables is 63,628 and from the raw tables 63,521. As of May 2017, Google Analytics currently does not expose that reports are sampled when using the raw data to create new joined tables.
However, when a certain date range includes over 100 million sessions, and an ad hoc query such as an applied segment, secondary dimension, or advanced filter is requested, then will Google Analytics expose that the report is sampled.
- Use a smaller date range to reduce the number of sessions (though be wary of adding numbers, like total users, together from separate date ranges)
- If you are using 360, create an Unsampled Report
- If you are using 360, create a Custom Table in order for GA to select the dimension/metric combinations you need into an unsampled table.