You have probably already heard of Google Analytics 4 (GA4) and how it is a completely different analytics tool with an increased feature set that promises to bring mobile app and web data together in a simpler and more powerful way than Universal Analytics (GA3). One common question about GA4 everyone is asking is what those new powerful features are. Thanks to the new demo property Google just released for GA4, you can now not only see the new UI and data model in action, but you can also easily explore those new features like funnels, event/content pathing and even the new debugging UI.
New GA4 Demo Properties
Google has released two new public GA4 demo properties with different implementations designed to highlight different features of GA4 properties. The first is a web-only GA4 property that highlights the eCommerce functionality. The second is a web and app implementation that shows new reporting features and the combined web/app reporting. Both of these properties are available to anyone; you will just need to get access to the Google Analytics Demo Account by clicking here. You can also find more information by reading this support article.
In this blog post, we’ll focus on the new event-focused data model, the difference in acquisition reporting between GA3 and GA4 and lastly, the new Analysis Hub. I am going to use screenshots from the web-only GA4 property. However, all of the topics I will talk about apply to both equally.
New GA4 Event-Focused Data Model
For years GA users have been familiar with the event category, action and label hierarchy that GA3 uses for its event reporting. With GA4, Google has chosen the event and parameter data model that Firebase Analytics uses.
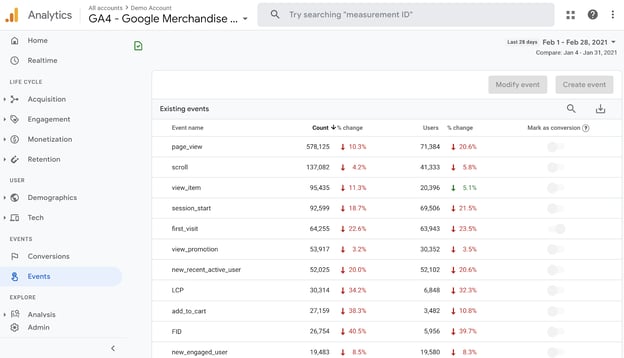
Instead of drilling down through an event category -> event action -> event label like you would in GA3, GA4’s data structure is a lot less hierarchical. Instead, you just have an event and its parameters (some of which may be configured as custom dimensions/metrics). This makes the GA4 data model much more flexible for reporting and makes default reports simpler. When you do click into a specific event, you will see more details about the event as well as any additional CDs/CMs that may be on the event.

I will not get into the details of how the events, parameters and Custom Dimensions/Custom Metrics work here, but it is important to get familiar with how this information populates in reporting. As GA4 becomes more feature-rich and begins to surpass GA3, it is going to be increasingly important to be able to speak to what reporting you need and how they may show up in GA4 so that you can make informed implementation decisions.
Acquisition Reporting: Differences Between GA3 and GA4
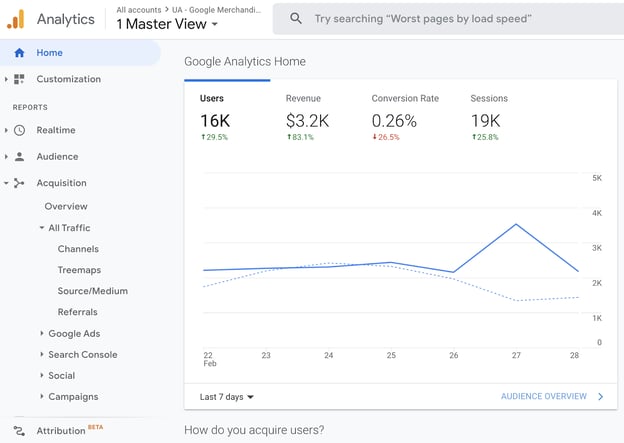
As you start using GA4 you will notice one thing very quickly: by default, GA4 has less basic reporting than GA3 but that reporting is easier to adjust for your specific use case. Take the acquisition collection of reports, for example. In GA4, there are only three default reports compared to GA3’s 31 default reports (some of this is due to product connections that are not yet available in the GA4 demo properties, but the point still stands).
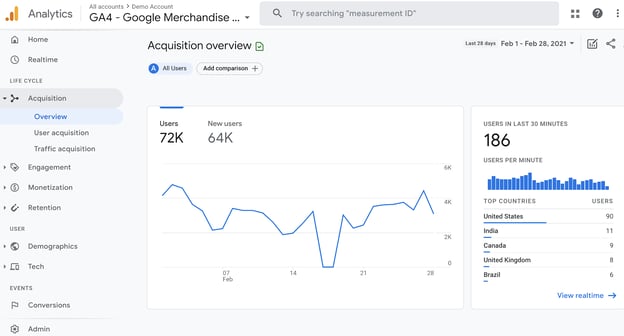
The above screenshot is GA4 vs. GA3 below.
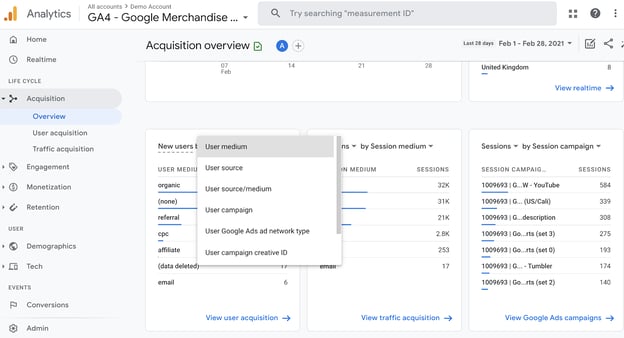
This change will definitely impact the way that you use and engage with GA4 within the user interface. In GA4, you will see these drop-down menus throughout the default reporting and they will change that data that is shown in the report. In GA3, to change the dimensions in reporting like this you would need to add a secondary dimension or just change default reports. GA4’s ability to change the dimensions in the reports means that although there are less overall reports, the reports that are there are easier to customize and adapt to help address the question you are asking the data.
New Analysis Hub
The last thing I will touch on is possibly the most powerful change in GA4 and one that I think will be hugely beneficial for end users of GA4: the new Analysis Hub.
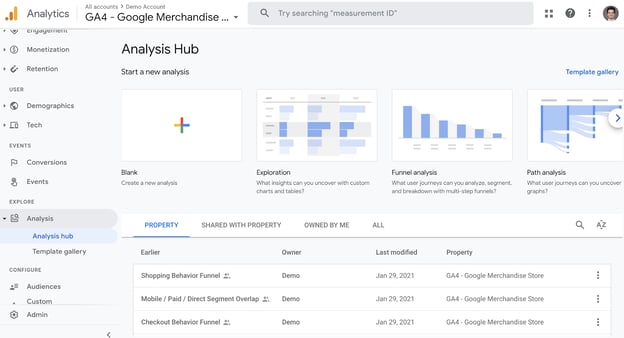
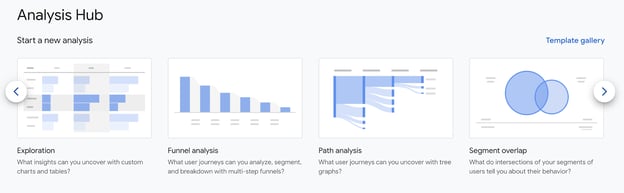
Custom reporting has always been powerful in GA3, but GA4’s version of it gives more flexibility and adds additional report times that will make long-time users of GA3 happy. First, you will have access to several different types of reports. The below screenshot shows just a few, but within those templates are more options.
For example, the path analysis report can show both forward pathing and backwards pathing using events or page title/screen name.
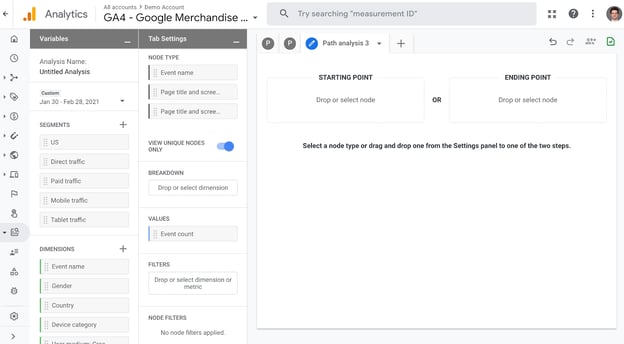
While you can always use GA4 data in BigQuery or Data Studio, a lot of end users may not have the technical skills or time to use those product connections. Analysis hub is a great way to explore the flexible new data model in ways that were previously impossible or very difficult to do in the GA3 UI.
While I focused on the path analysis report, the other templates are all equally as exciting in their own right. The funnel analysis reports allows users to create more flexible funnel reporting with more steps and customization options than were available in GA3 reports. Exploration analysis gives you additional options for tables and charts and gives more control over the report itself than was previously possible in GA3 as well.
Overall, GA4 is a big step forward for Google Analytics and the new features that Google has rolled out (and are currently working on adding)will change the way we engage with GA in the future for the better. While the Google Analytics demo account is an amazing resource, the best way to learn about GA4 and future-proof your Google Analytics Implementation is to begin tagging for both GA3 and GA4. Reach out to Adswerve for help with a dual tagging strategy and implementation.
Want more GA4 help? Be sure to check out our latest GA4U on-demand webinar series, "New Conversion and Event Feature." Be sure to check back on our blog for upcoming webinar dates.