A/B testing typically means we want to test a new variation against an existing variation to determine if the new variation performs better against a carefully chosen KPI. Variation in the marketing analytics context can be many things. For example, it could be changing the shape of buttons on our website. It could be adding a certain feature, or perhaps testing a new creative. The examples are endless. In more formal terms, we call the existing variation a control and the new variation a treatment. We are trying to find out the effect of the treatment compared to the control.
The idea is pretty straightforward, and the execution can be as well. All we need to do is conduct a randomized experiment. The beauty of a randomized experiment is that the treatment (a new variation) is assigned randomly, which means you can compare the treatment and control groups directly against one another. The randomization part ensures that, on average, everything stays the same between groups, and the only part that changes is that one thing you are trying to test for. Hence, whatever effect the treatment produces can be deemed causal. There are many platforms out there that enable you to do just that very effectively. One of our previous blog posts talks about some of the best available.
Data gathered through a randomized experiment is usually called experimental data, but we are not here to talk about it (other than this quick introduction that hopefully will provide some good context). We are here to discuss observational data.
What is observational data, you might ask? Well, it is just data that is being collected or observed. Analytics data is a good example — we just observe what our visitors do on our website.
Sometimes, we want to look at observational data and infer things from it. Sometimes, we are tempted to infer causal relationships even though we haven’t run a randomized experiment. And if we do so, we could get in trouble quickly. The temptation is very real because randomized experiments might not be possible, or may take too much time or any other set of reasons that prevents us from carefully setting them up.
But still, we have the data, so surely we can do something with it. Consider this example: We want to measure the effect of using the search feature on our e-commerce website. Does using the search impact how large a purchase visitors make on average? The effect would be the dollar difference between the two groups — those who used search and those who did not. It would be hard to convince management to randomly show and hide the search bar to our visitors, as we know it is one of the core parts of the website itself. In this case, we have to turn to our observational data about our visitors to hopefully get some insights.
This shouldn’t be too hard. What if we just practice our SQL a bit, dig into our analytics data, find all visitors who used search and those who didn’t and simply calculate the average purchase value for each group? Then all we need to do is subtract one from the other to see which group has, on average, a higher purchase value. For example, we observe that those who used search purchase $10 more on average than those who didn’t use search. Search works. Case closed.
Or is it? All we did was establish that using search is correlated with a higher purchase value, but can we really claim that this is a causal effect just due to the search feature? Not really; we did not split our two groups at random. What if people who use search are just much more interested in making a larger purchase? Or could it be that people who don’t use search just know what to buy? Or maybe a visitor more interested in actually making a purchase will naturally use search to find what they need? Perhaps some visitors are more likely to use search in general as part of their online shopping behavior.
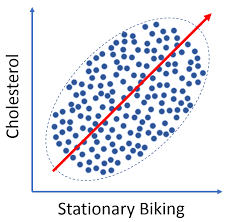
The point is that our two groups, searchers and non-searchers, are simply not comparable. They consist of different types of visitors due to a lack of randomization. By comparing those groups directly, we ignore a ton of possible confounding effects, which could give us a completely wrong answer.
However, since the treatment (searchers) and the control (non-searchers) are not assigned at random, what can we do to get closer to a real causal answer? Ideally, what we need to do is find out what a visitor who used search would do if they didn’t use search, and vice versa. Unfortunately, this is impossible, since if someone used search, we can’t go back in time and observe the same visitor playing out their journey without using search. We have the factual observation, a visitor who used search while browsing, but we don’t have the counterfactual, which is that same visitor not using search.
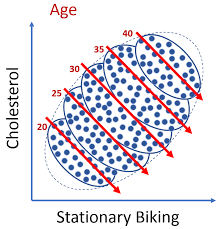
A keen observer might already have an inkling of where this is going. On the high level, we are slowly descending into a brave world of causal inference, but more specifically, what if we were able to find visitors who are very comparable across different metrics such as number of sessions, time on site, device, pageviews, previous purchases, etc., but different in the usage of search. We could, in theory, match up each visitor who used search to a comparable visitor who didn’t use search. This would, in theory, be very close to a randomized experiment, as we would be able to compare two very similar groups that only differ on search usage.
Essentially, what we are looking to do is to control for confounding effects. The most basic technique would be to create groups within groups to compare against. For example, compare visitors who used search vs. visitors who didn’t while all visitors had one session, two sessions, three sessions and so on. Now, at least, we are comparing visitors with the same number of sessions. We can calculate the average difference in each “session group” and average it out across all “session groups'' weighted by the group size.
This could be our more accurate search feature effect, where we control for the number of sessions. Sessions, in this case, is a confounder. It's reasonable to assume that visitors with more sessions are more likely to use search but also more likely to make a larger purchase.
It can get tedious pretty quickly since there are a ton of possible confounders we want to control for, so hopefully, there is a better technique we can apply.
We can find one such technique in causal inference literature under propensity model matching. It has different variations, such as weighting and stratifying instead of matching. Despite the variety of methods, all aim to achieve the same goal: to ensure that, given confounders or control variables (such as the number of sessions, pageviews, etc.), the treatment and control groups are as similar as possible. By equalizing these groups across all confounders, we can directly compare them and more accurately estimate the true causal effect of using the search feature on our website.
We will leave the technical parts for another time. But now you know about a common trap you may face when answering seemingly simple questions that may, in fact, be a bit more complicated.
Hopefully, this blog post sparked some interest in causal rather than correlational thinking. If you have any questions or comments, please feel free to contact us.